File:Sinc function (normalized).svg
跳转到导航
跳转到搜索

此SVG文件的PNG预览的大小:800 × 549像素。 其他分辨率:320 × 220像素 | 640 × 439像素 | 1,024 × 703像素 | 1,280 × 878像素 | 2,560 × 1,756像素 | 908 × 623像素。
原始文件 (SVG文件,尺寸为908 × 623像素,文件大小:4 KB)
说明
说明
添加一行文字以描述该文件所表现的内容
摘要
[编辑]| 描述 |
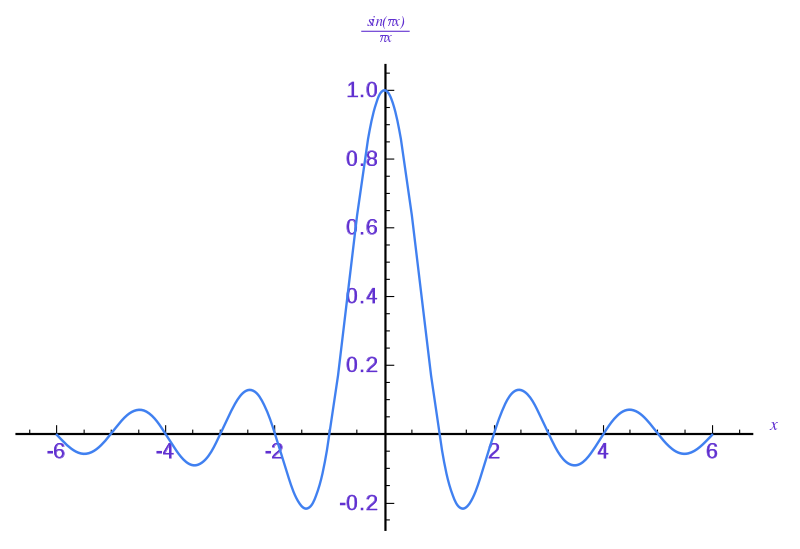
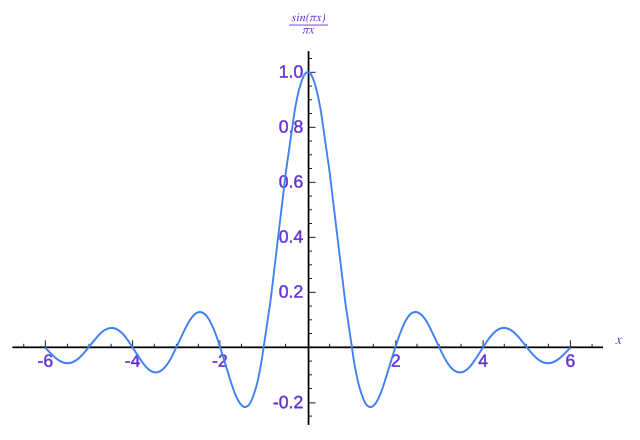
English: Graph of the normalized sinc function sin(πx)/(πx).
The original was generated by gnuplot, while the more recent one was generated with matplotlib. File size was reduced by efficient coding of the axis drawing and labeling and by a reworking of the graph's path. The resulting path is smoother even though fewer points are used in its determination. Please do not replace the simplified code of this file with a version created with Inkscape or any other vector graphics editor Omegatron's instructions: |
| 日期 | 2006年5月22日 (上传日期) |
| 来源 | 自己的作品 |
| 作者 | Omegatron |
| 其他版本 |
|
| gnuplot source | click to expand
# Set 1300×975 SVG output and filename
# The font size (fsize) sets the size for the circles, too.
set samples 400
set terminal svg enhanced size 1300 975 fname "Times" fsize 36
set output "sinc function (normalized).svg"

# Set y axis limits so the plot doesn't go right to the edges of the graph
set yrange [-0.3:1.1]
set xrange [-6:6]

set lmargin 5
set bmargin -5

# No legend needed
set nokey

# Add lightly-colored axis lines
set yzeroaxis
set xzeroaxis

# Put a y-axis tic at every 0.2
set ytics 0.2
set mytics 4

# Format tics as digit with one decimal place
set format y "%2.1f"

# Put an x-axis tic at every integer
set xtics 1
set format x "%2.0f"
set mxtics 5

# Plot as lines
plot sin(pi*x)/(pi*x) with lines

# Close the file (so I don't have to close gnuplot to view it)
set output
|
.svg)
.svg)
.svg)
.svg&action=edit§ion=1)
许可协议
[编辑].svg&action=edit§ion=2)
我,本作品著作权人,特此采用以下许可协议发表本作品:
- 您可以自由地:
- 共享 – 复制、发行并传播本作品
- 修改 – 改编作品
- 惟须遵守下列条件:
- 署名 – 您必须对作品进行署名,提供授权条款的链接,并说明是否对原始内容进行了更改。您可以用任何合理的方式来署名,但不得以任何方式表明许可人认可您或您的使用。
- 相同方式共享 – 如果您再混合、转换或者基于本作品进行创作,您必须以与原先许可协议相同或相兼容的许可协议分发您贡献的作品。

|
已授权您依据自由软件基金会发行的无固定段落及封面封底文字(Invariant Sections, Front-Cover Texts, and Back-Cover Texts)的GNU自由文件许可协议1.2版或任意后续版本的条款,复制、传播和/或修改本文件。该协议的副本请见“GNU Free Documentation License”。 |
您可以选择您需要的许可协议。
文件历史
点击某个日期/时间查看对应时刻的文件。
| 日期/时间 | 缩略图 | 大小 | 用户 | 备注 | |
|---|---|---|---|---|---|
| 当前 | 2012年4月6日 (五) 09:42 | | 908 × 623(4 KB) | Aflafla1(留言 | 贡献) | Compressed Version - Sinc path computed, rest hand coded |
| 2010年12月4日 (六) 01:20 |  | 454 × 311(37 KB) | Krishnavedala(留言 | 贡献) | (corrected SVG code and beautified) | |
| 2006年6月3日 (六) 17:36 |  | 1,300 × 975(23 KB) | Omegatron(留言 | 贡献) | i think we can squeeze in all the integers | |
| 2006年6月3日 (六) 17:32 |  | 1,300 × 975(19 KB) | Omegatron(留言 | 贡献) | thicker lines, tweaks | |
| 2006年5月22日 (一) 03:03 |  | 1,000 × 750(14 KB) | Omegatron(留言 | 贡献) |
您不可以覆盖此文件。
文件用途
以下6个页面使用本文件:
全域文件用途
以下其他wiki使用此文件:
- ar.wikipedia.org上的用途
- bn.wikipedia.org上的用途
- ca.wikipedia.org上的用途
- de.wikipedia.org上的用途
- el.wikipedia.org上的用途
- en.wikipedia.org上的用途
- eo.wikipedia.org上的用途
- es.wikipedia.org上的用途
- et.wikipedia.org上的用途
- hu.wikipedia.org上的用途
- it.wikipedia.org上的用途
- it.wikibooks.org上的用途
- ko.wikipedia.org上的用途
- www.mediawiki.org上的用途
- pt.wikipedia.org上的用途
- ro.wikipedia.org上的用途
- ru.wikipedia.org上的用途
- sr.wikipedia.org上的用途
- sv.wikipedia.org上的用途
- zh.wikipedia.org上的用途
.svg&oldid=453245613)