File:U.S. incarceration rates 1925 onwards.png
Jump to navigation
Jump to search
Size of this preview: 800 × 468 pixels. Other resolutions: 320 × 187 pixels | 640 × 374 pixels | 1,024 × 599 pixels | 1,280 × 748 pixels | 2,880 × 1,684 pixels.
Original file (2,880 × 1,684 pixels, file size: 49 KB, MIME type: image/png)
Captions
Captions
Add a one-line explanation of what this file represents
Summary[edit]
| Description |
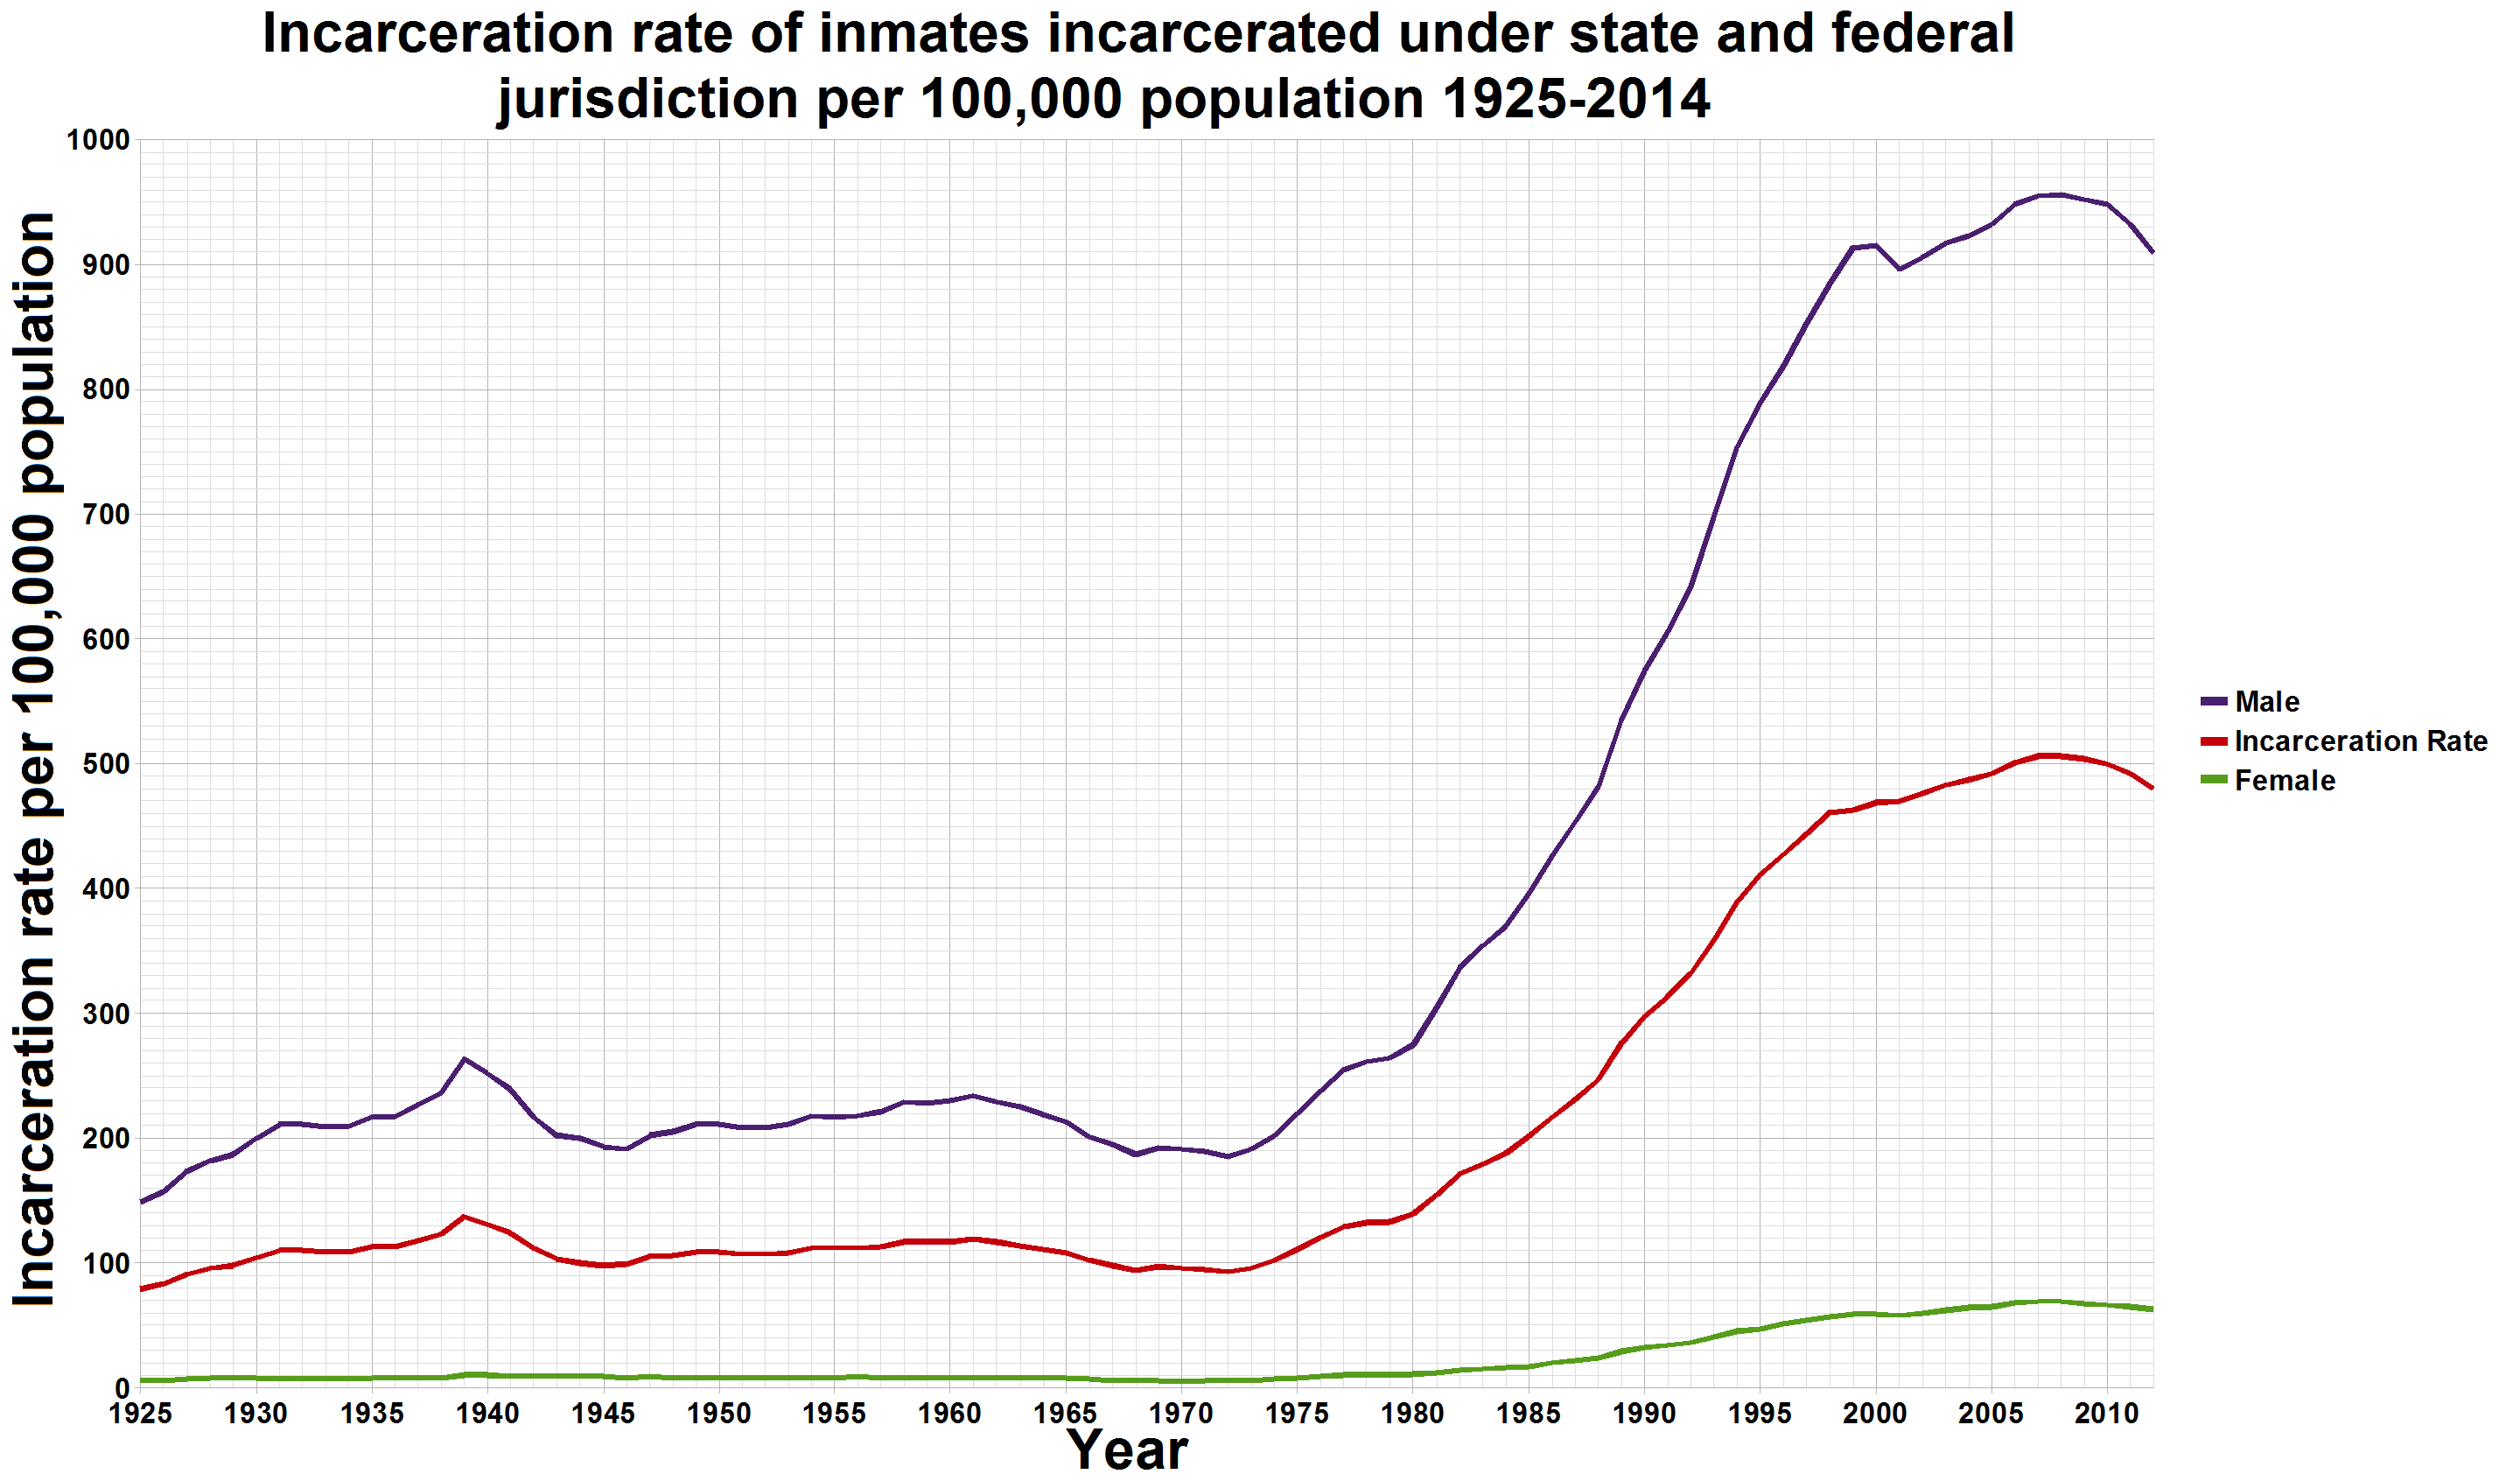
English: A graph made in excel 2007 showing the incarceration rate per 100,000 population in the United States. It shows the female and male rate, as well as their average. The graph depicts the incarceration rate of sentenced prisoners under jurisdiction of State and Federal correctional authorities from 1925 through 2014. It does not include jail inmates. 2003-2013 data from Bureau of Justice (Prisoners in 2013, p13t03.csv and p13t05.csv) |
| Date | 5 January 2010 (original upload date) |
| Source | I, Smallman12q (talk), created the graph from the data available at http://bjs.ojp.usdoj.gov/content/glance/tables/incrttab.cfm for the 2003 - 2008 incarceration rate. I used Table 6.28 on page 500 from the "Sourcebook of criminal justice statistics 2003" http://www.albany.edu/sourcebook/pdf/section6.pdf for the rate by sex (gender) for 1925-2008. The sources for that table are as follows: U.S. Department of Justice, Bureau of Justice Statistics, Prisoners1925-81, Bulletin NCJ-85861, p. 2; Prisoners in 1998, Bulletin NCJ 175687, p. 3,Table 3 and p. 5, Table 6; 2000, Bulletin NCJ 188207, p. 5, Table 6; 2001, BulletinNCJ 195189, p. 5 and p. 6, Table 7; 2002, Bulletin NCJ 200248, p. 4 and p. 5, Table5; 2003, Bulletin NCJ 205335, p. 4 (Washington, DC: U.S. Department of Justice);and U.S. Department of Justice, Bureau of Justice Statistics, Correctional Populationsin the United States, 1994, NCJ-160091, Tables 1.8 and 1.9; 1997, NCJ177613, Tables 1.8 and 1.9 (Washington, DC: U.S. Department of Justice). |
| Author | Smallman12q (talk) |
| Other versions | File:U.S. incarceration rate since 1925.svg; en:File:Incarceration rate of inmates incarcerated under state and federal jurisdiction per 100,000 population 1925-2008.pdf. |
The data chart is below. The rates are per 100,000 population of all ages.
| Year | Total | Incarceration Rate |
Male Total |
Male Rate |
Female Total |
Female Rate |
| 1925 | 91,669 | 79 | 88,231 | 149 | 3,438 | 6 |
| 1926 | 97,991 | 83 | 94,287 | 157 | 3,704 | 6 |
| 1927 | 109,983 | 91 | 104,983 | 173 | 4,363 | 7 |
| 1928 | 116,390 | 96 | 111,836 | 182 | 4,554 | 8 |
| 1929 | 120,496 | 98 | 115,876 | 187 | 4,620 | 8 |
| 1930 | 129,453 | 104 | 124,785 | 200 | 4,668 | 8 |
| 1931 | 137,082 | 110 | 132,638 | 211 | 4,444 | 7 |
| 1932 | 137,997 | 110 | 133,573 | 211 | 4,424 | 7 |
| 1933 | 136,810 | 109 | 132,520 | 209 | 4,290 | 7 |
| 1934 | 138,316 | 109 | 133,769 | 209 | 4,547 | 7 |
| 1935 | 144,180 | 113 | 139,278 | 217 | 4,902 | 8 |
| 1936 | 145,038 | 113 | 139,990 | 217 | 5,048 | 8 |
| 1937 | 152,741 | 118 | 147,375 | 227 | 5,366 | 8 |
| 1938 | 160,285 | 123 | 154,826 | 236 | 5,459 | 8 |
| 1939 | 179,818 | 137 | 173,143 | 263 | 6,675 | 10 |
| 1940 | 173,706 | 131 | 167,345 | 252 | 6,361 | 10 |
| 1941 | 165,439 | 124 | 159,228 | 239 | 6,211 | 9 |
| 1942 | 150,384 | 112 | 144,167 | 217 | 6,217 | 9 |
| 1943 | 137,220 | 103 | 131,054 | 202 | 6,166 | 9 |
| 1944 | 132,456 | 100 | 126,350 | 200 | 6,106 | 9 |
| 1945 | 133,649 | 98 | 127,609 | 193 | 6,040 | 9 |
| 1946 | 140,079 | 99 | 134,075 | 191 | 6,004 | 8 |
| 1947 | 151,304 | 105 | 144,961 | 202 | 6,343 | 9 |
| 1948 | 155,977 | 106 | 149,739 | 205 | 6,238 | 8 |
| 1949 | 163,749 | 109 | 157,663 | 211 | 6,086 | 8 |
| 1950 | 166,123 | 109 | 160,309 | 211 | 5,814 | 8 |
| 1951 | 165,680 | 107 | 159,610 | 208 | 6,070 | 8 |
| 1952 | 168,233 | 107 | 161,994 | 208 | 6,239 | 8 |
| 1953 | 173,579 | 108 | 166,909 | 211 | 6,670 | 8 |
| 1954 | 182,901 | 112 | 175,907 | 218 | 6,994 | 8 |
| 1955 | 185,780 | 112 | 178,655 | 217 | 7,125 | 8 |
| 1956 | 189,565 | 112 | 182,190 | 218 | 7,375 | 9 |
| 1957 | 195,414 | 113 | 188,113 | 221 | 7,301 | 8 |
| 1958 | 205,643 | 117 | 198,208 | 229 | 7,435 | 8 |
| 1959 | 208,105 | 117 | 200,469 | 228 | 7,636 | 8 |
| 1960 | 212,953 | 117 | 205,265 | 230 | 7,688 | 8 |
| 1961 | 220,149 | 119 | 212,268 | 234 | 7,881 | 8 |
| 1962 | 218,830 | 117 | 210,823 | 229 | 8,007 | 8 |
| 1963 | 217,283 | 114 | 209,538 | 225 | 7,745 | 8 |
| 1964 | 214,336 | 111 | 206,632 | 219 | 7,704 | 8 |
| 1965 | 210,895 | 108 | 203,327 | 213 | 7,568 | 8 |
| 1966 | 199,654 | 102 | 192,703 | 201 | 6,951 | 7 |
| 1967 | 194,896 | 98 | 188,661 | 195 | 6,235 | 6 |
| 1968 | 187,914 | 94 | 182,102 | 187 | 5,812 | 6 |
| 1969 | 196,007 | 97 | 189,413 | 192 | 6,594 | 6 |
| 1970 | 196,429 | 96 | 190,794 | 191 | 5,635 | 5 |
| 1971 | 198,061 | 95 | 191,732 | 189 | 6,329 | 6 |
| 1972 | 196,092 | 93 | 189,823 | 185 | 6,269 | 6 |
| 1973 | 204,211 | 96 | 197,523 | 191 | 6,004 | 6 |
| 1974 | 218,466 | 102 | 211,077 | 202 | 7,389 | 7 |
| 1975 | 240,593 | 111 | 231,918 | 220 | 8,675 | 8 |
| 1976 | 262,833 | 120 | 252,794 | 238 | 10,039 | 9 |
| 1977 | 285,456 | 129 | 274,244 | 255 | 11,212 | 10 |
| 1978 | 294,396 | 132 | 282,813 | 261 | 11,583 | 10 |
| 1979 | 301,470 | 133 | 289,465 | 264 | 12,005 | 10 |
| 1980 | 315,974 | 139 | 303,643 | 275 | 12,331 | 11 |
| 1981 | 353,673 | 154 | 339,375 | 304 | 14,298 | 12 |
| 1982 | 395,516 | 171 | 379,075 | 337 | 16,441 | 14 |
| 1983 | 419,346 | 179 | 401,870 | 354 | 17,476 | 15 |
| 1984 | 443,398 | 188 | 424,193 | 370 | 19,205 | 16 |
| 1985 | 480,568 | 202 | 459,223 | 397 | 21,345 | 17 |
| 1986 | 522,084 | 217 | 497,540 | 426 | 24,544 | 20 |
| 1987 | 560,812 | 231 | 533,990 | 453 | 26,822 | 22 |
| 1988 | 603,732 | 247 | 573,587 | 482 | 30,145 | 24 |
| 1989 | 680,907 | 276 | 643,643 | 535 | 37,264 | 29 |
| 1990 | 739,980 | 297 | 699,416 | 575 | 40,564 | 32 |
| 1991 | 789,610 | 313 | 745,808 | 606 | 43,802 | 34 |
| 1992 | 846,277 | 332 | 799,776 | 642 | 46,501 | 36 |
| 1993 | 932,074 | 359 | 878,037 | 698 | 54,037 | 41 |
| 1994 | 1,016,691 | 389 | 956,566 | 753 | 60,125 | 45 |
| 1995 | 1,085,022 | 411 | 1,021,059 | 789 | 63,963 | 47 |
| 1996 | 1,137,722 | 427 | 1,068,123 | 819 | 69,599 | 51 |
| 1997 | 1,194,581 | 444 | 1,120,787 | 853 | 73,794 | 54 |
| 1998 | 1,245,402 | 461 | 1,167,802 | 885 | 77,600 | 57 |
| 1999 | 1,304,074 | 463 | 1,221,611 | 913 | 82,463 | 59 |
| 2000 | 1,331,278 | 469 | 1,246,234 | 915 | 85,044 | 59 |
| 2001 | 1,345,217 | 470 | 1,260,033 | 896 | 85,184 | 58 |
| 2002 | 1,380,516 | 476 | 1,291,450 | 906 | 89,066 | 60 |
| 2003 | 1,408,361 | 483 | 1,315,790 | 917 | 92,571 | 62 |
| 2004 | 1,433,728 | 487 | 1,337,730 | 923 | 95,998 | 64 |
| 2005 | 1,462,866 | 492 | 1,364,178 | 932 | 98,688 | 65 |
| 2006 | 1,504,598 | 501 | 1,401,261 | 948 | 103,337 | 68 |
| 2007 | 1,532,851 | 506 | 1,427,088 | 955 | 105,763 | 69 |
| 2008 | 1,547,742 | 506 | 1,441,384 | 956 | 106,358 | 69 |
| 2009 | 1,553,574 | 504 | 1,448,239 | 952 | 105,335 | 67 |
| 2010 | 1,552,669 | 500 | 1,447,766 | 948 | 104,903 | 66 |
| 2011 | 1,538,847 | 492 | 1,435,141 | 932 | 103,706 | 65 |
| 2012 | 1,511,480 | 480 | 1,410,191 | 909 | 101,289 | 63 |
| 2013 | 1,576,950 | 477 | 1,465,592 | 903 | 111,358 | 65 |
| 2014 | 1,561,525 | 471 | 1,448,564 | 890 | 112,961 | 65 |

|
This graph image could be re-created using vector graphics as an SVG file. This has several advantages; see Commons:Media for cleanup for more information. If an SVG form of this image is available, please upload it and afterwards replace this template with
{{vector version available|new image name}}.
It is recommended to name the SVG file “U.S. incarceration rates 1925 onwards.svg”—then the template Vector version available (or Vva) does not need the new image name parameter. |
Licensing[edit]
| This work has been released into the public domain by its author, Smallman12q at English Wikipedia. This applies worldwide. In some countries this may not be legally possible; if so: Smallman12q grants anyone the right to use this work for any purpose, without any conditions, unless such conditions are required by law. |
Original upload log[edit]
The original description page was here. All following user names refer to en.wikipedia.
Upload date | User | Bytes | Dimensions | Comment
- 2010-01-05 17:49:42 | Smallman12q | 29961 | 2882×1674 | {{Information |Description = A graph made in excel showing the incarceration rate per 100,000 population in the United States. It shows the female and male rate, as well as their average. The graph depicts under the rate (per 100,000 resident populati
File history
Click on a date/time to view the file as it appeared at that time.
| Date/Time | Thumbnail | Dimensions | User | Comment | |
|---|---|---|---|---|---|
| current | 22:05, 2 October 2016 | | 2,880 × 1,684 (49 KB) | Cmdrjameson (talk | contribs) | Compressed with pngout. Reduced by 132kB (72% decrease). |
| 03:38, 31 March 2016 |  | 2,880 × 1,684 (181 KB) | Delphi234 (talk | contribs) | update | |
| 03:09, 1 November 2014 |  | 2,880 × 1,684 (110 KB) | Delphi234 (talk | contribs) | update | |
| 02:29, 1 November 2014 |  | 2,880 × 1,684 (185 KB) | Delphi234 (talk | contribs) | update | |
| 03:37, 20 May 2014 |  | 2,880 × 1,684 (98 KB) | Delphi234 (talk | contribs) | update | |
| 17:10, 13 August 2011 |  | 2,882 × 1,674 (29 KB) | Timeshifter (talk | contribs) | {{BotMoveToCommons|en.wikipedia|year={{subst:CURRENTYEAR}}|month={{subst:CURRENTMONTHNAME}}|day={{subst:CURRENTDAY}}}} The upload bot is User:CommonsHelper2 Bot which is called by [http://toolserver.org/~commonshelper2/index.php CommonsHelper2]. The t |
You cannot overwrite this file.
File usage on Commons
There are no pages that use this file.
File usage on other wikis
The following other wikis use this file:
- Usage on en.wikipedia.org
- Usage on en.wikiversity.org
- Usage on es.wikipedia.org
- Usage on fr.wikipedia.org
- Usage on it.wikipedia.org
- Usage on ka.wikipedia.org
- Usage on pt.wikipedia.org
- Usage on vi.wikipedia.org
- Usage on www.wikidata.org