File:Vostok Petit data.svg

元のファイル (SVG ファイル、1,024 × 768 ピクセル、ファイルサイズ: 81キロバイト)
キャプション
キャプション
概要
[編集]
| 解説 |
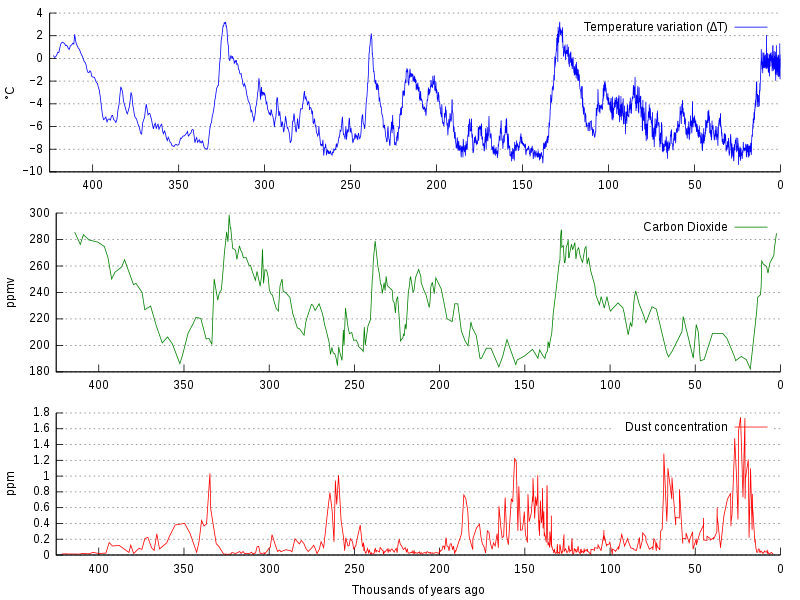
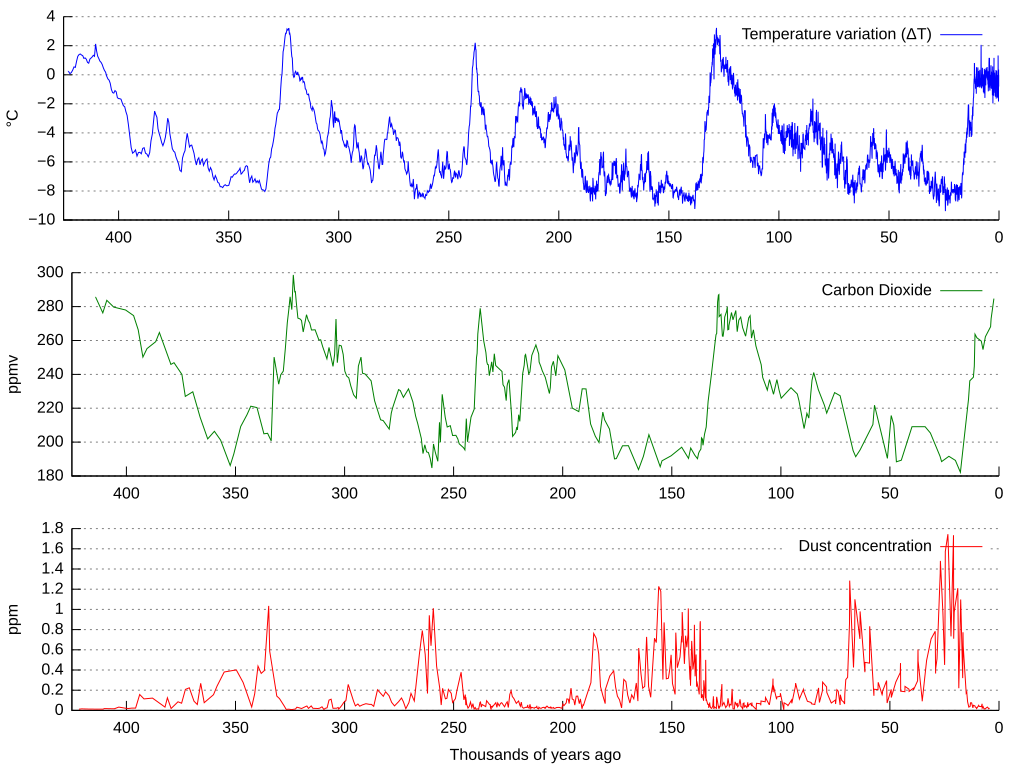
La bildo estas kopiita de wikipedia:en. La originala priskribo estas: Graph of CO2 (Green graph), temperature (Blue graph), and dust concentration (Red graph) measured from the Vostok, Antarctica ice core as reported by Petit et al., 1999. Higher dust levels are believed to be caused by cold, dry periods. The Earth's orbital eccentricity, tilt, and precession vary in a pattern over thousands of years. The IPCC notes that Milankovitch cycles drove the ice age cycles; CO2 followed temperature change "with a lag of some hundreds of years" (visible on a graph more zoomed in than this); and that as a feedback amplified temperature change. Among other factors, CO2 is more soluble in colder than in warmer waters. العربية: مخطّطٌ يُبيّن علاقة ثاني أوكسيد الكاربون ودرجة الحرارة وتركيز الغبار في قالب جليد فوستوك (بالإنجليزيّة: Vostok ice core) خلال 450,000 سنة الماضيّة |
| 日付 | |
| 原典 | 次の画像を基にした投稿者自身による著作物: Vostok-ice-core-petit.png 次のものによる: NOAA |
| 作者 |
原作: 不明 ベクタ: |
| その他のバージョン |
このファイルの派生的著作物: |
| SVG 開発 | このSVGファイルはSVGの<switch>要素を用いることで翻訳されています: 全ての翻訳は同一ファイル中に保存されています。 |
Data sets used are:
- ftp://ftp.ncdc.noaa.gov/pub/data/paleo/icecore/antarctica/vostok/deutnat.txt
- ftp://ftp.ncdc.noaa.gov/pub/data/paleo/icecore/antarctica/vostok/co2nat.txt
- ftp://ftp.ncdc.noaa.gov/pub/data/paleo/icecore/antarctica/vostok/dustnat.txt
ソースコード
Gnuplot code
unset multiplot
set term svg size 1024,768
set output "vostok-data.svg"

set border 3
set xtics nomirror
set ytics nomirror
unset xlabel
unset ylabel

set grid y
set multiplot layout 3,1

set ylabel "°C"
plot [-425:0] [-10:4] \
        "deutnat.txt" \
        using (-$2/1000):4 \
        title "Temperature variation (ΔT)" \
        ls 3 \
        with lines

set ylabel "ppmv"
plot [-425:0] \
        "co2nat.txt" \
        using (-$1/1000):2 \
        title "Carbon Dioxide" \
        ls 2 \
        with lines

set xlabel "Thousands of years ago"
set ylabel "ppm"
plot [-425:0] \
        "dustnat.txt" \
        using (-$1/1000):2 \
        title "Dust concentration" \
        ls 1 \
        with lines
Explanation
After executing gnuplot, the resulting SVG file was manually changed to
* remove the negative signs for the x axis values
* change the [[:w:hyphen-minus|hyphen-minus]] characters in the temperature axis values to proper minus sign characters
| このファイルはクリエイティブ・コモンズ 表示-継承 3.0 非移植ライセンスのもとに利用を許諾されています。 | ||
| ||
| このライセンスのテンプレートは、GFDLのライセンス・アップデートによりこのファイルに追加されたものです。 |

|
この文書は、フリーソフトウェア財団発行のGNUフリー文書利用許諾書 (GNU Free Documentation License) 1.2またはそれ以降のバージョンの規約に基づき、複製や再配布、改変が許可されます。不可変更部分、表紙、背表紙はありません。このライセンスの複製は、GNUフリー文書利用許諾書という章に含まれています。 |
元のアップロードログ
[編集]
This image is a derivative work of the following images:
- Vostok-ice-core-petit.png licensed with Cc-by-sa-3.0-migrated, GFDL
- 2006-02-15T20:38:10Z Maksim 598x441 (31557 Bytes) La bildo estas kopiita de wikipedia:en. La originala priskribo estas: Graph of [[carbon dioxide|CO2]], [[temperature]], and dust concentration measured from the [[Vostok, Antarctica]] [[ice core]] as reported by Petit et al.
Uploaded with derivativeFX
ファイルの履歴
過去の版のファイルを表示するには、その版の日時をクリックしてください。
| 日付と時刻 | サムネイル | 寸法 | 利用者 | コメント | |
|---|---|---|---|---|---|
| 現在の版 | 2021年6月25日 (金) 13:01 | | 1,024 × 768(81キロバイト) | Matěj Orlický(トーク | 投稿記録) | File uploaded using svgtranslate tool (https://svgtranslate.toolforge.org/). Added translation for cs. |
| 2013年11月30日 (土) 22:25 |  | 1,024 × 768(77キロバイト) | SeL media(トーク | 投稿記録) | time axis reversed | |
| 2011年9月25日 (日) 17:39 |  | 1,024 × 768(309キロバイト) | Hel-hama(トーク | 投稿記録) | text improved | |
| 2011年4月27日 (水) 03:07 |  | 1,024 × 768(83キロバイト) | Awickert(トーク | 投稿記録) | Didn't realize that it was a draw-on box instead of a measuring-box. Take 3! | |
| 2011年4月27日 (水) 03:05 |  | 1,024 × 768(83キロバイト) | Awickert(トーク | 投稿記録) | [Shoot - last time, picked original instead of new version to upload] Manually moved axes in Inkscape such that the three plots line up with one another | |
| 2011年4月27日 (水) 03:02 |  | 1,024 × 768(75キロバイト) | Awickert(トーク | 投稿記録) | Manually moved axes in Inkscape such that the three plots line up with one another | |
| 2010年6月20日 (日) 13:25 |  | 1,024 × 768(75キロバイト) | Autopilot(トーク | 投稿記録) | {{Information |Description=La bildo estas kopiita de wikipedia:en. La originala priskribo estas: Graph of CO<sub>2</sub> (Green graph), temperature (Blue graph), and dust concentration (Red graph) measured from the [[Vostok, Antarc |
このファイルは上書きできません。
ファイルの使用状況
以下の 5 ページがこのファイルを使用しています:
グローバルなファイル使用状況
以下に挙げる他のウィキがこの画像を使っています:
- af.wikipedia.org での使用状況
- ar.wikipedia.org での使用状況
- be.wikipedia.org での使用状況
- bg.wikipedia.org での使用状況
- ca.wikipedia.org での使用状況
- cs.wikipedia.org での使用状況
- cy.wikipedia.org での使用状況
- da.wikipedia.org での使用状況
- de.wikipedia.org での使用状況
- en.wikipedia.org での使用状況
- Climate variability and change
- Global cooling
- Ice core
- Orbital forcing
- Quaternary glaciation
- Carbon dioxide in Earth's atmosphere
- Talk:Ice age/Archive 1
- File talk:Vostok Petit data.svg
- List of periods and events in climate history
- User talk:Jc-S0CO/Archives/2013/2
- User:Mark Buchanan/sandbox/QuatGlac
- User:Mark Buchanan/sandbox/Glaciation-WIP
- Portal:Climate change
- Talk:Climate variability and change/Archive 8
- en.wikiversity.org での使用状況
- es.wikipedia.org での使用状況
- eu.wikipedia.org での使用状況
- fa.wikipedia.org での使用状況
- fi.wikipedia.org での使用状況
- fi.wikiversity.org での使用状況
- fr.wikipedia.org での使用状況
- gl.wikipedia.org での使用状況
- ha.wikipedia.org での使用状況
- he.wikipedia.org での使用状況
- it.wikipedia.org での使用状況
- ja.wikipedia.org での使用状況
このファイルのグローバル使用状況を表示する。