File:WHO Covid 2020 Jan-Aug daily C Israel.pdf
Jump to navigation
Jump to search

Size of this JPG preview of this PDF file: 800 × 473 pixels. Other resolutions: 320 × 189 pixels | 640 × 378 pixels | 1,024 × 605 pixels | 1,280 × 756 pixels | 3,300 × 1,950 pixels.
Original file (3,300 × 1,950 pixels, file size: 24 KB, MIME type: application/pdf)
Captions
Captions
Add a one-line explanation of what this file represents
Summary
[edit]| Description |
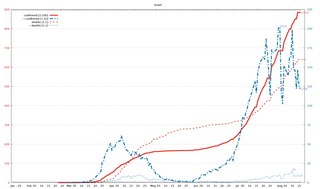
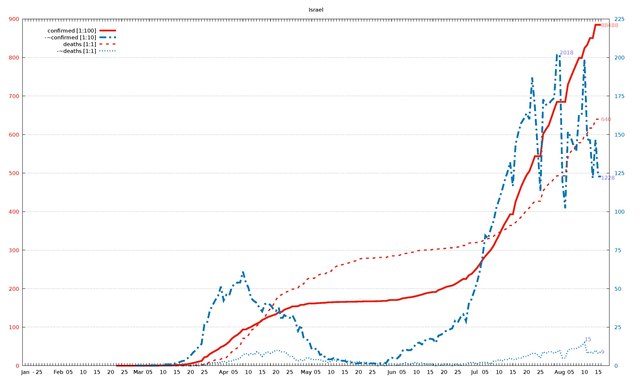
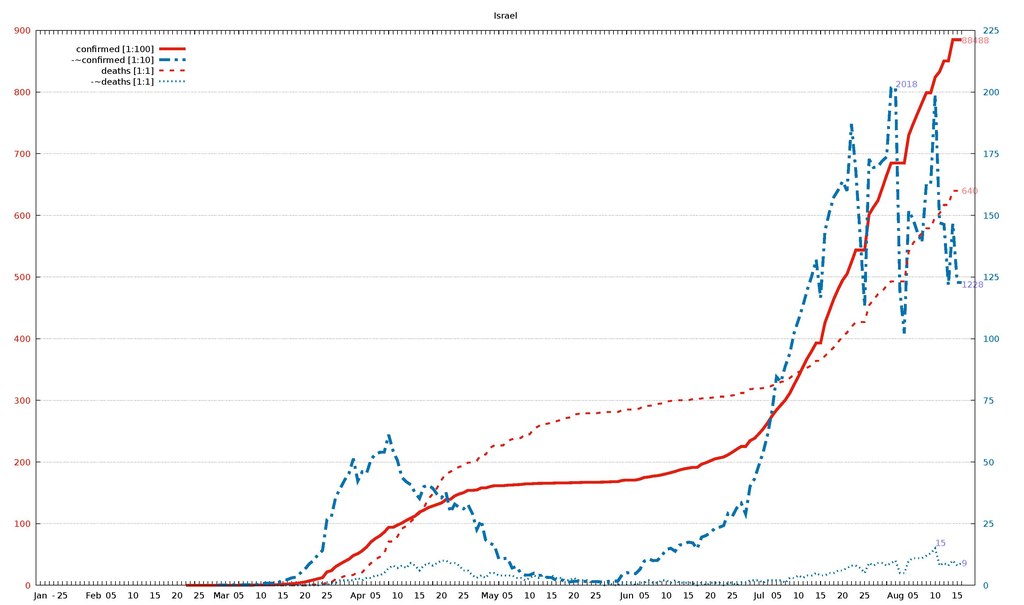
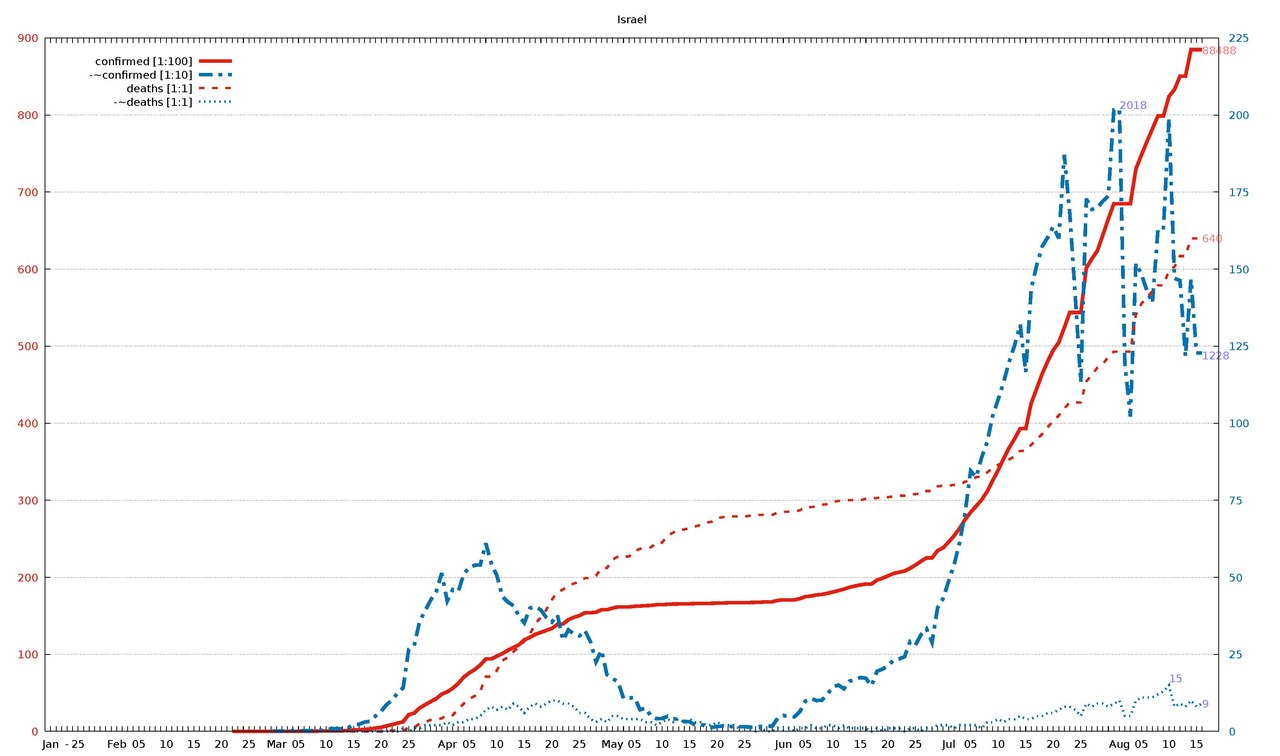
English: Diagram of WHO COVID-19 daily data (20 Jan - 16 Aug 2020) for "Total Confirmed Cases" (thick solid line), its smoothed increment (thick dash-dotted line), "Total Deaths" (thin dashed line) , and its smoothed increment (thin dotted line). Figures are taken from the available situation reports. Red and blue lines refer to the left and right vertical axis, respectively; the scaling factor for each curve is given in the legend. The horizontal axis starts on 20 Jan 2020 (situation report 1), and ends on 16 Aug 2020 (situation report 209). In the smoothed curves, for each day, 1/7 of the difference of the current day's figure and the figure a week ago is shown. For example, in situation report 115 (14 May 2020) and 121 (21 May 2020), there were 8676 and 5339 Total Confirmed Cases in Afghanistan, respectively, so the thick dash-dotted line passes through 477 = (8676-5339)/7 on 21 May.
For an overview of all related visualizations, and a more detailled description, see WHO Covid diagram set#Available country diagrams Jan-Aug 2020 (daily). |
| Date | |
| Source | Own work |
| Author | Jochen Burghardt |
Licensing
[edit]I, the copyright holder of this work, hereby publish it under the following license:
This file is licensed under the Creative Commons Attribution-Share Alike 4.0 International license.
- You are free:
- to share – to copy, distribute and transmit the work
- to remix – to adapt the work
- Under the following conditions:
- attribution – You must give appropriate credit, provide a link to the license, and indicate if changes were made. You may do so in any reasonable manner, but not in any way that suggests the licensor endorses you or your use.
- share alike – If you remix, transform, or build upon the material, you must distribute your contributions under the same or compatible license as the original.
Gnuplot source code
[edit]| Gnuplot source code |
|---|
set term pdf size 22,13
set term pdf font "sans,20"
set output "WHO_Covid_C_Israel.pdf"
set key autotitle columnhead
set termoption noenhanced
# (1) norm: 885 202 640 001
# (2) dist: 1,0:228 2,0:139 2,1:317
# (3,4) dist max: 317 2:640--1:202
# (4) right: 0 1 0 1
# (6,7) scMax: 900 225
# (8) scale: [1:100] [1:10] [1:1] [1:1]


set xrange [-1:212]
set yrange [0:900]
set y2range [0:225]
set xtics 3650,100
set ytics 100 textcolor "#e51e10"
set y2tics 25 textcolor "#0072b2"
set grid y y2

set title "Israel"

$data <<EOF
rep day "confirmed [1:100]" "-~confirmed [1:10]" "deaths [1:1]" "-~deaths [1:1]"
1	Jan	.	-	.	-
2	""	.	-	.	-
3	""	.	-	.	-
-	-	-	-	-	-
4	""	.	-	.	-
5	25	.	-	.	-
6	""	.	-	.	-
7	""	.	-	.	-
8	""	.	-	.	-
9	""	.	-	.	-
10	""	.	-	.	-
11	""	.	-	.	-
12	Feb	.	-	.	-
13	""	.	-	.	-
14	""	.	-	.	-
15	""	.	-	.	-
16	05	.	-	.	-
17	""	.	-	.	-
18	""	.	-	.	-
19	""	.	-	.	-
20	""	.	-	.	-
21	10	.	-	.	-
22	""	.	-	.	-
23	""	.	-	.	-
24	""	.	-	.	-
25	""	.	-	.	-
26	15	.	-	.	-
27	""	.	-	.	-
28	""	.	-	.	-
29	""	.	-	.	-
30	""	.	-	.	-
31	20	.	-	.	-
32	""	.	-	.	-
33	""	1	-	0	-
34	""	1	-	0	-
35	""	1	-	0	-
36	25	2	-	0	-
37	""	2	-	0	-
38	""	2	-	0	-
39	""	3	-	0	-
40	""	5	0	0	0
41	Mar	7	1	0	0
42	""	7	1	0	0
43	""	10	1	0	0
44	""	12	2	0	0
45	05	15	1	0	0
46	""	15	2	0	0
47	""	19	2	0	0
48	""	25	3	0	0
49	""	39	4	0	0
50	10	39	4	0	0
51	""	75	9	0	0
52	""	75	9	0	0
53	""	75	9	0	0
54	""	100	11	0	0
55	15	178	22	0	0
56	""	200	23	0	0
57	""	250	30	0	0
58	""	304	33	0	0
59	""	427	50	0	0
60	20	529	65	0	0
61	""	712	87	1	0
62	""	883	101	1	0
63	""	1071	125	1	0
64	""	1238	141	1	1
65	25	2170	266	5	0
66	""	2369	278	5	1
67	""	3035	358	10	1
68	""	3460	392	12	2
69	""	3865	426	15	2
70	""	4247	454	15	2
71	""	4831	513	17	2
72	Apr	5129	423	21	3
73	""	5591	460	21	2
74	""	6211	454	29	3
75	""	7030	510	36	3
76	05	7589	532	42	4
77	""	8018	539	46	4
78	""	8611	540	52	5
79	""	9404	610	71	7
80	""	9404	545	71	8
81	10	9755	506	79	7
82	""	10095	438	92	8
83	""	10525	420	96	7
84	""	10878	408	103	9
85	""	11235	375	110	8
86	15	11868	352	117	6
87	""	12200	400	126	8
88	""	12591	405	140	9
89	""	12855	394	148	8
90	""	13107	369	158	9
91	20	13362	355	171	10
92	""	13883	378	181	10
93	""	13942	296	184	9
94	""	14498	329	189	9
95	""	14803	316	192	8
96	25	15028	310	194	6
97	""	15398	327	199	6
98	""	15398	291	199	4
99	""	15466	226	202	3
100	""	15782	263	212	4
101	""	15782	184	212	3
102	May	16004	171	223	5
103	""	16152	161	227	5
104	""	16152	107	227	4
105	""	16152	108	227	4
106	05	16237	110	234	4
107	""	16268	70	237	4
108	""	16314	76	238	3
109	""	16346	49	239	3
110	""	16444	41	245	2
111	10	16444	42	245	3
112	""	16492	49	254	4
113	""	16526	41	258	3
114	""	16539	39	262	4
115	""	16539	32	262	3
116	15	16567	31	264	4
117	""	16589	21	266	3
118	""	16608	23	268	3
119	""	16607	17	271	2
120	""	16621	13	272	2
121	20	16650	16	277	3
122	""	16659	17	278	2
123	""	16690	18	279	2
124	""	16690	14	279	2
125	""	16712	15	279	1
126	25	16712	15	279	2
127	""	16720	14	280	1
128	""	16743	14	281	0
129	""	16771	16	281	1
130	""	16809	17	281	0
131	""	16809	17	281	0
132	""	17012	43	284	1
133	Jun	17071	51	285	1
134	""	17071	50	285	1
135	""	17071	47	285	0
136	""	17219	64	287	1
137	05	17495	98	291	1
138	""	17562	107	291	2
139	""	17706	100	292	1
140	""	17783	101	294	1
141	""	17915	121	295	2
142	10	18089	145	298	2
143	""	18268	150	299	1
144	""	18461	138	300	2
145	""	18701	163	300	1
146	""	18876	167	300	1
147	15	19008	175	300	1
148	""	19121	172	302	1
149	""	19121	148	302	0
150	""	19637	195	303	1
151	""	19876	202	303	0
152	20	20188	213	304	1
153	""	20494	231	305	1
154	""	20652	235	306	1
155	""	20813	242	306	0
156	""	21158	291	307	1
157	25	21597	280	308	1
158	""	22078	314	308	0
159	""	22519	333	312	1
160	""	22519	289	312	1
161	""	23457	401	318	2
162	""	23830	431	319	2
163	Jul	24567	487	319	2
164	""	25385	541	320	1
165	""	26358	612	320	2
166	""	27489	710	324	2
167	05	28433	845	326	2
168	""	29236	825	330	2
169	""	30055	889	331	1
170	""	31137	939	336	3
171	""	32543	1023	342	3
172	10	33903	1077	346	4
173	""	35426	1134	349	3
174	""	36821	1199	353	4
175	""	38015	1254	357	4
176	""	39294	1320	364	5
177	15	39294	1165	364	4
178	""	42602	1437	372	4
179	""	44498	1513	379	5
180	""	46444	1574	386	5
181	""	48041	1603	395	6
182	20	49481	1638	403	6
183	""	50493	1600	410	7
184	""	52381	1870	419	8
185	""	54369	1681	427	8
186	""	54369	1410	427	7
187	25	54369	1132	427	5
188	""	60140	1728	454	9
189	""	61339	1694	463	8
190	""	62376	1698	472	9
191	""	64428	1721	477	9
192	""	66527	1737	486	8
193	""	68492	2017	493	9
194	Aug	68492	2018	493	10
195	""	68492	1193	493	5
196	""	68492	1022	493	5
197	""	73012	1519	541	10
198	05	74816	1484	555	11
199	""	76535	1430	564	11
200	""	78220	1390	571	11
201	""	79892	1628	579	12
202	""	79892	1629	579	13
203	10	82416	1989	598	15
204	""	83300	1470	603	8
205	""	85056	1463	617	9
206	""	85056	1217	617	8
207	""	88488	1467	640	10
208	15	88488	1228	640	8
209	""	88488	1228	640	9
EOF

# confirmed:
set label "88488  " at first 209,884           left back textcolor "#ff8080"
# -~confirmed:
set label "1228   " at first 209,122*900/225   left back textcolor "#8080ff"
set label "2018   " at first 194,201*900/225+9 left back textcolor "#8080ff"
# deaths:
set label "640    " at first 209,640           left back textcolor "#ff8080"
# -~deaths:
set label "9      " at first 209,  9*900/225   left back textcolor "#8080ff"
set label "15     " at first 203, 15*900/225+9 left back textcolor "#8080ff"

set multiplot
  plot $data using 0:($3/    100        ) with lines lc 7 lw 8 dt 1 title at 0.150, 0.920
replot $data using 0:($4/     10*900/225) with lines lc 6 lw 8 dt 4 title at 0.150, 0.902
replot $data using 0:($5/      1        ) with lines lc 7 lw 5 dt 2 title at 0.150, 0.884
replot $data using 0:($6/      1*900/225) with lines lc 6 lw 5 dt 3 title at 0.150, 0.866

# plot hor axis calendar
replot $data using 0:(0):xticlabel(2) with lines
|
File history
Click on a date/time to view the file as it appeared at that time.
| Date/Time | Thumbnail | Dimensions | User | Comment | |
|---|---|---|---|---|---|
| current | 19:14, 24 September 2020 |  | 3,300 × 1,950 (24 KB) | Jochen Burghardt (talk | contribs) | =={{int:filedesc}}== {{Information |description={{en|1=Diagram of WHO COVID-19 daily data (20 Jan - 16 Aug 2020) for ''"Total Confirmed Cases"'' (thick solid line), its smoothed increment (thick dash-dotted line), ''"Total Deaths"'' (thin dashed line), and its smoothed increment (thin dotted line); see File:WHO_Covid_2020_Jan-Aug_daily_C_Afghanistan.pdf for details.}} |date=2020-09-24 |source={{own}} |author=Jochen Burghardt |permission= |other_versions=[[:File:... |
You cannot overwrite this file.
File usage on Commons
There are no pages that use this file.