File:WHO Covid 2020 Jan-Aug daily C Malawi.pdf
Jump to navigation
Jump to search

Size of this JPG preview of this PDF file: 800 × 473 pixels. Other resolutions: 320 × 189 pixels | 640 × 378 pixels | 1,024 × 605 pixels | 1,280 × 756 pixels | 3,300 × 1,950 pixels.
Original file (3,300 × 1,950 pixels, file size: 22 KB, MIME type: application/pdf)
Captions
Captions
Add a one-line explanation of what this file represents
Summary
[edit]| Description |
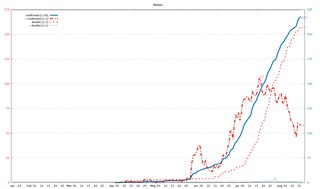
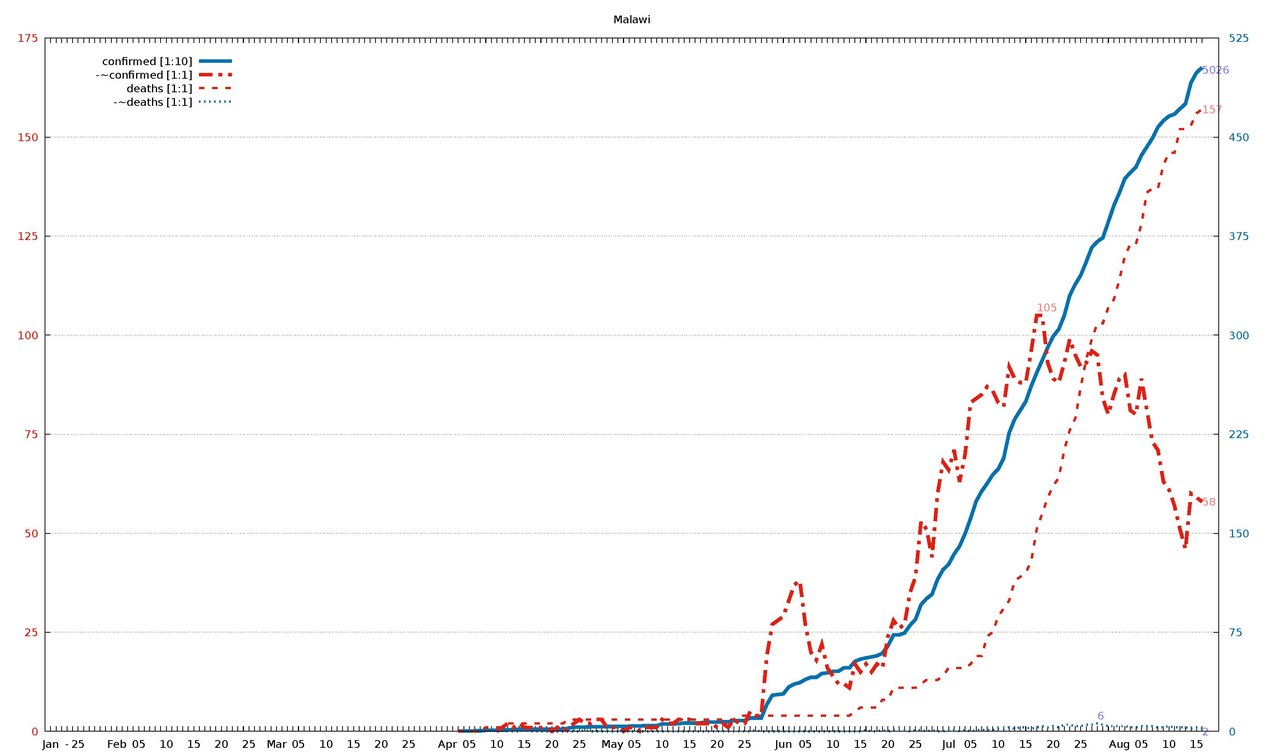
English: Diagram of WHO COVID-19 daily data (20 Jan - 16 Aug 2020) for "Total Confirmed Cases" (thick solid line), its smoothed increment (thick dash-dotted line), "Total Deaths" (thin dashed line) , and its smoothed increment (thin dotted line). Figures are taken from the available situation reports. Red and blue lines refer to the left and right vertical axis, respectively; the scaling factor for each curve is given in the legend. The horizontal axis starts on 20 Jan 2020 (situation report 1), and ends on 16 Aug 2020 (situation report 209). In the smoothed curves, for each day, 1/7 of the difference of the current day's figure and the figure a week ago is shown. For example, in situation report 115 (14 May 2020) and 121 (21 May 2020), there were 8676 and 5339 Total Confirmed Cases in Afghanistan, respectively, so the thick dash-dotted line passes through 477 = (8676-5339)/7 on 21 May.
For an overview of all related visualizations, and a more detailled description, see WHO Covid diagram set#Available country diagrams Jan-Aug 2020 (daily). |
| Date | |
| Source | Own work |
| Author | Jochen Burghardt |
Licensing
[edit]I, the copyright holder of this work, hereby publish it under the following license:
This file is licensed under the Creative Commons Attribution-Share Alike 4.0 International license.
- You are free:
- to share – to copy, distribute and transmit the work
- to remix – to adapt the work
- Under the following conditions:
- attribution – You must give appropriate credit, provide a link to the license, and indicate if changes were made. You may do so in any reasonable manner, but not in any way that suggests the licensor endorses you or your use.
- share alike – If you remix, transform, or build upon the material, you must distribute your contributions under the same or compatible license as the original.
Gnuplot source code
[edit]| Gnuplot source code |
|---|
set term pdf size 22,13
set term pdf font "sans,20"
set output "WHO_Covid_C_Malawi.pdf"
set key autotitle columnhead
set termoption noenhanced
# (1) norm: 503 105 157 001
# (2) dist: 1,0:208 2,0:312 2,1:150
# (3,4) dist max: 312 2:157--0:503
# (4) right: 1 0 0 1
# (6,7) scMax: 175 525
# (8) scale: [1:10] [1:1] [1:1] [1:1]


set xrange [-1:212]
set yrange [0:175]
set y2range [0:525]
set xtics 3650,100
set ytics 25 textcolor "#e51e10"
set y2tics 75 textcolor "#0072b2"
set grid y y2

set title "Malawi"

$data <<EOF
rep day "confirmed [1:10]" "-~confirmed [1:1]" "deaths [1:1]" "-~deaths [1:1]"
1	Jan	.	-	.	-
2	""	.	-	.	-
3	""	.	-	.	-
-	-	-	-	-	-
4	""	.	-	.	-
5	25	.	-	.	-
6	""	.	-	.	-
7	""	.	-	.	-
8	""	.	-	.	-
9	""	.	-	.	-
10	""	.	-	.	-
11	""	.	-	.	-
12	Feb	.	-	.	-
13	""	.	-	.	-
14	""	.	-	.	-
15	""	.	-	.	-
16	05	.	-	.	-
17	""	.	-	.	-
18	""	.	-	.	-
19	""	.	-	.	-
20	""	.	-	.	-
21	10	.	-	.	-
22	""	.	-	.	-
23	""	.	-	.	-
24	""	.	-	.	-
25	""	.	-	.	-
26	15	.	-	.	-
27	""	.	-	.	-
28	""	.	-	.	-
29	""	.	-	.	-
30	""	.	-	.	-
31	20	.	-	.	-
32	""	.	-	.	-
33	""	.	-	.	-
34	""	.	-	.	-
35	""	.	-	.	-
36	25	.	-	.	-
37	""	.	-	.	-
38	""	.	-	.	-
39	""	.	-	.	-
40	""	.	-	.	-
41	Mar	.	-	.	-
42	""	.	-	.	-
43	""	.	-	.	-
44	""	.	-	.	-
45	05	.	-	.	-
46	""	.	-	.	-
47	""	.	-	.	-
48	""	.	-	.	-
49	""	.	-	.	-
50	10	.	-	.	-
51	""	.	-	.	-
52	""	.	-	.	-
53	""	.	-	.	-
54	""	.	-	.	-
55	15	.	-	.	-
56	""	.	-	.	-
57	""	.	-	.	-
58	""	.	-	.	-
59	""	.	-	.	-
60	20	.	-	.	-
61	""	.	-	.	-
62	""	.	-	.	-
63	""	.	-	.	-
64	""	.	-	.	-
65	25	.	-	.	-
66	""	.	-	.	-
67	""	.	-	.	-
68	""	.	-	.	-
69	""	.	-	.	-
70	""	.	-	.	-
71	""	.	-	.	-
72	Apr	.	-	.	-
73	""	.	-	.	-
74	""	3	-	0	-
75	""	3	-	0	-
76	05	3	-	0	-
77	""	4	-	0	-
78	""	4	-	0	-
79	""	8	-	1	-
80	""	8	-	1	-
81	10	8	0	1	0
82	""	9	1	1	1
83	""	12	2	2	0
84	""	13	1	2	0
85	""	16	2	2	0
86	15	16	1	2	1
87	""	16	1	2	0
88	""	16	1	2	0
89	""	17	1	2	0
90	""	17	1	2	0
91	20	17	0	2	0
92	""	17	1	2	0
93	""	18	0	2	0
94	""	23	1	3	0
95	""	33	2	3	0
96	25	33	3	3	0
97	""	33	2	3	1
98	""	34	2	3	0
99	""	36	3	3	0
100	""	36	3	3	0
101	""	36	1	3	0
102	May	37	1	3	0
103	""	37	1	3	0
104	""	38	0	3	0
105	""	39	1	3	0
106	05	41	1	3	0
107	""	41	0	3	0
108	""	43	1	3	0
109	""	43	1	3	0
110	""	43	1	3	0
111	10	56	3	3	0
112	""	56	2	3	0
113	""	57	2	3	0
114	""	58	3	3	0
115	""	63	3	3	0
116	15	63	3	3	0
117	""	63	2	3	0
118	""	65	2	3	0
119	""	70	2	3	0
120	""	70	2	3	0
121	20	71	1	3	0
122	""	72	2	3	0
123	""	72	1	3	0
124	""	82	3	3	0
125	""	83	2	4	0
126	25	83	2	4	0
127	""	101	5	4	0
128	""	101	4	4	1
129	""	101	4	4	0
130	""	203	19	4	0
131	""	273	27	4	0
132	""	279	28	4	0
133	Jun	284	29	4	0
134	""	336	33	4	0
135	""	358	37	4	0
136	""	369	38	4	0
137	05	393	27	4	0
138	""	409	20	4	0
139	""	409	18	4	0
140	""	438	22	4	0
141	""	443	16	4	0
142	10	455	14	4	0
143	""	455	12	4	0
144	""	481	12	4	0
145	""	481	11	4	0
146	""	529	17	5	0
147	15	547	15	6	0
148	""	556	17	6	1
149	""	564	15	6	0
150	""	572	17	6	0
151	""	592	16	8	1
152	20	648	24	8	0
153	""	730	28	11	1
154	""	730	26	11	1
155	""	745	27	11	1
156	""	803	35	11	0
157	25	848	39	11	1
158	""	960	53	12	1
159	""	1005	51	13	0
160	""	1038	44	13	1
161	""	1152	60	13	0
162	""	1224	68	14	0
163	Jul	1265	66	16	1
164	""	1342	71	16	1
165	""	1402	63	16	0
166	""	1498	70	16	1
167	05	1613	83	17	0
168	""	1742	84	19	1
169	""	1818	85	19	1
170	""	1877	87	24	1
171	""	1942	86	25	1
172	10	1986	83	29	2
173	""	2069	82	31	2
174	""	2261	92	33	3
175	""	2364	89	38	2
176	""	2430	88	39	3
177	15	2497	88	40	3
178	""	2614	96	43	2
179	""	2716	105	51	3
180	""	2810	105	55	4
181	""	2907	93	59	3
182	20	2992	89	62	4
183	""	3045	88	64	3
184	""	3149	93	71	5
185	""	3302	99	76	5
186	""	3386	95	79	4
187	25	3454	92	87	4
188	""	3557	93	94	5
189	""	3664	96	99	5
190	""	3709	95	103	6
191	""	3738	84	103	5
192	""	3858	80	107	4
193	""	3981	85	109	4
194	Aug	4078	89	114	4
195	""	4186	90	120	4
196	""	4231	81	123	3
197	""	4273	80	123	3
198	05	4361	89	128	4
199	""	4426	81	136	4
200	""	4491	73	137	4
201	""	4575	71	137	3
202	""	4624	63	143	3
203	10	4658	61	146	4
204	""	4674	57	146	3
205	""	4714	51	152	3
206	""	4752	46	152	3
207	""	4912	60	153	2
208	15	4988	59	156	3
209	""	5026	58	157	2
EOF

# confirmed:
set label "5026   " at first 209,502*175/525   left back textcolor "#8080ff"
# -~confirmed:
set label "58     " at first 209, 58           left back textcolor "#ff8080"
set label "105    " at first 179,105        +2 left back textcolor "#ff8080"
# deaths:
set label "157    " at first 209,157           left back textcolor "#ff8080"
# -~deaths:
set label "2      " at first 209,  2*175/525   left back textcolor "#8080ff"
set label "6      " at first 190,  6*175/525+2 left back textcolor "#8080ff"

set multiplot
  plot $data using 0:($3/     10*175/525) with lines lc 6 lw 8 dt 1 title at 0.150, 0.920
replot $data using 0:($4/      1        ) with lines lc 7 lw 8 dt 4 title at 0.150, 0.902
replot $data using 0:($5/      1        ) with lines lc 7 lw 5 dt 2 title at 0.150, 0.884
replot $data using 0:($6/      1*175/525) with lines lc 6 lw 5 dt 3 title at 0.150, 0.866

# plot hor axis calendar
replot $data using 0:(0):xticlabel(2) with lines
|
File history
Click on a date/time to view the file as it appeared at that time.
| Date/Time | Thumbnail | Dimensions | User | Comment | |
|---|---|---|---|---|---|
| current | 19:20, 24 September 2020 |  | 3,300 × 1,950 (22 KB) | Jochen Burghardt (talk | contribs) | =={{int:filedesc}}== {{Information |description={{en|1=Diagram of WHO COVID-19 daily data (20 Jan - 16 Aug 2020) for ''"Total Confirmed Cases"'' (thick solid line), its smoothed increment (thick dash-dotted line), ''"Total Deaths"'' (thin dashed line), and its smoothed increment (thin dotted line); see File:WHO_Covid_2020_Jan-Aug_daily_C_Afghanistan.pdf for details.}} |date=2020-09-24 |source={{own}} |author=Jochen Burghardt |permission= |other_versions=[[:File:... |
You cannot overwrite this file.
File usage on Commons
There are no pages that use this file.