File:WHO Covid 2020 Jan-Aug daily C Maldives.pdf
Jump to navigation
Jump to search

Size of this JPG preview of this PDF file: 800 × 473 pixels. Other resolutions: 320 × 189 pixels | 640 × 378 pixels | 1,024 × 605 pixels | 1,280 × 756 pixels | 3,300 × 1,950 pixels.
Original file (3,300 × 1,950 pixels, file size: 22 KB, MIME type: application/pdf)
Captions
Captions
Add a one-line explanation of what this file represents
Summary
[edit]| Description |
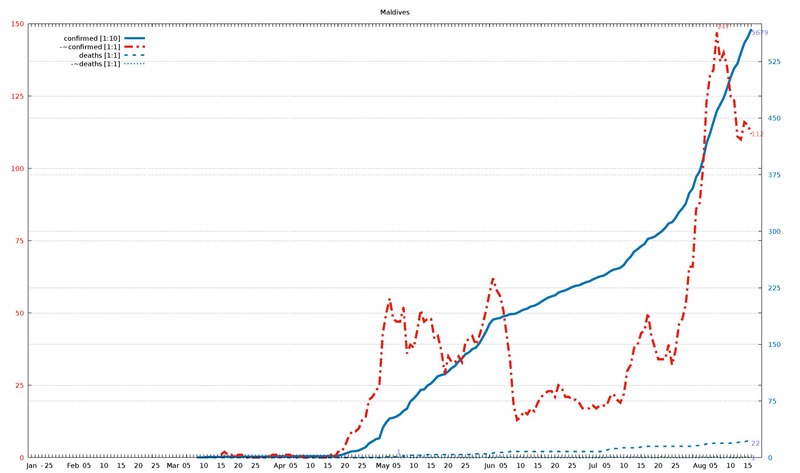
English: Diagram of WHO COVID-19 daily data (20 Jan - 16 Aug 2020) for "Total Confirmed Cases" (thick solid line), its smoothed increment (thick dash-dotted line), "Total Deaths" (thin dashed line) , and its smoothed increment (thin dotted line). Figures are taken from the available situation reports. Red and blue lines refer to the left and right vertical axis, respectively; the scaling factor for each curve is given in the legend. The horizontal axis starts on 20 Jan 2020 (situation report 1), and ends on 16 Aug 2020 (situation report 209). In the smoothed curves, for each day, 1/7 of the difference of the current day's figure and the figure a week ago is shown. For example, in situation report 115 (14 May 2020) and 121 (21 May 2020), there were 8676 and 5339 Total Confirmed Cases in Afghanistan, respectively, so the thick dash-dotted line passes through 477 = (8676-5339)/7 on 21 May.
For an overview of all related visualizations, and a more detailled description, see WHO Covid diagram set#Available country diagrams Jan-Aug 2020 (daily). |
| Date | |
| Source | Own work |
| Author | Jochen Burghardt |
Licensing
[edit]I, the copyright holder of this work, hereby publish it under the following license:
This file is licensed under the Creative Commons Attribution-Share Alike 4.0 International license.
- You are free:
- to share – to copy, distribute and transmit the work
- to remix – to adapt the work
- Under the following conditions:
- attribution – You must give appropriate credit, provide a link to the license, and indicate if changes were made. You may do so in any reasonable manner, but not in any way that suggests the licensor endorses you or your use.
- share alike – If you remix, transform, or build upon the material, you must distribute your contributions under the same or compatible license as the original.
Gnuplot source code
[edit]| Gnuplot source code |
|---|
set term pdf size 22,13
set term pdf font "sans,20"
set output "WHO_Covid_C_Maldives.pdf"
set key autotitle columnhead
set termoption noenhanced
# (1) norm: 568 147 001 001
# (2) dist: 1,0:258
# (3,4) dist max: 258 1:147--0:568
# (4) right: 1 0 1 1
# (6,7) scMax: 150 575
# (8) scale: [1:10] [1:1] [1:1] [1:1]


set xrange [-1:212]
set yrange [0:150]
set y2range [0:575]
set xtics 3650,100
set ytics 25 textcolor "#e51e10"
set y2tics 75 textcolor "#0072b2"
set grid y y2

set title "Maldives"

$data <<EOF
rep day "confirmed [1:10]" "-~confirmed [1:1]" "deaths [1:1]" "-~deaths [1:1]"
1	Jan	.	-	.	-
2	""	.	-	.	-
3	""	.	-	.	-
-	-	-	-	-	-
4	""	.	-	.	-
5	25	.	-	.	-
6	""	.	-	.	-
7	""	.	-	.	-
8	""	.	-	.	-
9	""	.	-	.	-
10	""	.	-	.	-
11	""	.	-	.	-
12	Feb	.	-	.	-
13	""	.	-	.	-
14	""	.	-	.	-
15	""	.	-	.	-
16	05	.	-	.	-
17	""	.	-	.	-
18	""	.	-	.	-
19	""	.	-	.	-
20	""	.	-	.	-
21	10	.	-	.	-
22	""	.	-	.	-
23	""	.	-	.	-
24	""	.	-	.	-
25	""	.	-	.	-
26	15	.	-	.	-
27	""	.	-	.	-
28	""	.	-	.	-
29	""	.	-	.	-
30	""	.	-	.	-
31	20	.	-	.	-
32	""	.	-	.	-
33	""	.	-	.	-
34	""	.	-	.	-
35	""	.	-	.	-
36	25	.	-	.	-
37	""	.	-	.	-
38	""	.	-	.	-
39	""	.	-	.	-
40	""	.	-	.	-
41	Mar	.	-	.	-
42	""	.	-	.	-
43	""	.	-	.	-
44	""	.	-	.	-
45	05	.	-	.	-
46	""	.	-	.	-
47	""	.	-	.	-
48	""	2	-	0	-
49	""	4	-	0	-
50	10	4	-	0	-
51	""	8	-	0	-
52	""	8	-	0	-
53	""	8	-	0	-
54	""	9	-	0	-
55	15	10	1	0	0
56	""	13	2	0	0
57	""	13	1	0	0
58	""	13	1	0	0
59	""	13	0	0	0
60	20	13	1	0	0
61	""	13	1	0	0
62	""	13	0	0	0
63	""	13	0	0	0
64	""	13	0	0	0
65	25	13	0	0	0
66	""	13	0	0	0
67	""	13	0	0	0
68	""	13	0	0	0
69	""	16	0	0	0
70	""	17	1	0	0
71	""	17	1	0	0
72	Apr	18	0	0	0
73	""	18	1	0	0
74	""	19	1	0	0
75	""	19	1	0	0
76	05	19	0	0	0
77	""	19	0	0	0
78	""	19	1	0	0
79	""	19	0	0	0
80	""	19	0	0	0
81	10	19	0	0	0
82	""	19	0	0	0
83	""	19	0	0	0
84	""	20	0	0	0
85	""	20	0	0	0
86	15	20	0	0	0
87	""	21	1	0	0
88	""	23	0	0	0
89	""	28	2	0	0
90	""	34	2	0	0
91	20	51	4	0	0
92	""	67	7	0	0
93	""	83	9	0	0
94	""	85	9	0	0
95	""	94	10	0	0
96	25	116	13	0	0
97	""	137	14	0	0
98	""	188	20	0	0
99	""	214	21	0	0
100	""	245	23	0	0
101	""	256	25	0	0
102	May	396	43	0	0
103	""	468	50	1	0
104	""	519	55	1	0
105	""	527	48	1	0
106	05	545	47	1	1
107	""	573	47	2	0
108	""	618	52	2	0
109	""	648	36	3	1
110	""	744	39	3	0
111	10	785	38	3	0
112	""	835	44	3	0
113	""	897	51	3	1
114	""	904	47	3	0
115	""	955	48	4	0
116	15	982	48	4	0
117	""	1031	41	4	0
118	""	1078	42	4	1
119	""	1094	37	4	0
120	""	1106	29	4	0
121	20	1143	35	4	0
122	""	1186	33	4	0
123	""	1216	33	4	0
124	""	1274	35	4	0
125	""	1313	33	4	0
126	25	1371	40	4	0
127	""	1395	41	4	0
128	""	1438	42	5	0
129	""	1457	39	5	0
130	""	1513	42	5	0
131	""	1591	46	5	1
132	""	1672	51	5	0
133	Jun	1773	57	5	0
134	""	1829	62	6	0
135	""	1841	58	7	0
136	""	1850	56	7	1
137	05	1872	51	7	0
138	""	1883	42	7	0
139	""	1901	33	8	1
140	""	1903	18	8	0
141	""	1916	13	8	0
142	10	1942	14	8	1
143	""	1962	16	8	0
144	""	1976	15	8	0
145	""	2003	17	8	0
146	""	2013	16	8	0
147	15	2035	19	8	0
148	""	2065	21	8	0
149	""	2094	22	8	0
150	""	2120	23	8	0
151	""	2137	23	8	0
152	20	2150	21	8	0
153	""	2187	25	8	0
154	""	2203	24	8	0
155	""	2217	21	8	0
156	""	2238	21	8	0
157	25	2260	20	8	0
158	""	2277	20	8	0
159	""	2283	19	8	0
160	""	2305	17	8	0
161	""	2324	17	8	0
162	""	2337	17	8	0
163	Jul	2361	18	8	0
164	""	2382	17	8	0
165	""	2400	18	8	0
166	""	2410	18	8	0
167	05	2435	18	10	0
168	""	2468	21	11	1
169	""	2491	22	12	0
170	""	2501	20	12	1
171	""	2517	19	13	1
172	10	2553	22	13	0
173	""	2617	30	13	1
174	""	2664	32	13	0
175	""	2731	38	13	1
176	""	2762	39	13	0
177	15	2801	43	14	0
178	""	2831	44	14	0
179	""	2899	50	15	1
180	""	2913	42	15	0
181	""	2930	38	15	0
182	20	2966	34	15	0
183	""	2999	34	15	1
184	""	3044	34	15	0
185	""	3103	39	15	0
186	""	3120	32	15	0
187	25	3175	37	15	0
188	""	3252	46	15	0
189	""	3302	48	15	0
190	""	3369	53	15	0
191	""	3506	66	15	0
192	""	3567	66	15	0
193	""	3719	86	16	0
194	Aug	3793	88	16	0
195	""	3949	100	17	1
196	""	4164	123	18	0
197	""	4293	132	18	0
198	05	4446	134	19	1
199	""	4594	147	19	1
200	""	4680	137	19	0
201	""	4769	140	19	0
202	""	4898	135	19	1
203	10	5041	125	19	0
204	""	5157	124	19	0
205	""	5223	111	20	0
206	""	5366	110	21	0
207	""	5494	116	21	1
208	15	5572	115	22	0
209	""	5679	112	22	1
EOF

# confirmed:
set label "5679   " at first 209,567*150/575   left back textcolor "#8080ff"
# -~confirmed:
set label "112    " at first 209,112           left back textcolor "#ff8080"
set label "147    " at first 199,147        +2 left back textcolor "#ff8080"
# deaths:
set label "22     " at first 209, 22*150/575   left back textcolor "#8080ff"
# -~deaths:
set label "1      " at first 209,  1*150/575   left back textcolor "#8080ff"
set label "1      " at first 106,  1*150/575+2 left back textcolor "#8080ff"

set multiplot
  plot $data using 0:($3/     10*150/575) with lines lc 6 lw 8 dt 1 title at 0.150, 0.920
replot $data using 0:($4/      1        ) with lines lc 7 lw 8 dt 4 title at 0.150, 0.902
replot $data using 0:($5/      1*150/575) with lines lc 6 lw 5 dt 2 title at 0.150, 0.884
replot $data using 0:($6/      1*150/575) with lines lc 6 lw 5 dt 3 title at 0.150, 0.866

# plot hor axis calendar
replot $data using 0:(0):xticlabel(2) with lines
|
File history
Click on a date/time to view the file as it appeared at that time.
| Date/Time | Thumbnail | Dimensions | User | Comment | |
|---|---|---|---|---|---|
| current | 19:20, 24 September 2020 |  | 3,300 × 1,950 (22 KB) | Jochen Burghardt (talk | contribs) | =={{int:filedesc}}== {{Information |description={{en|1=Diagram of WHO COVID-19 daily data (20 Jan - 16 Aug 2020) for ''"Total Confirmed Cases"'' (thick solid line), its smoothed increment (thick dash-dotted line), ''"Total Deaths"'' (thin dashed line), and its smoothed increment (thin dotted line); see File:WHO_Covid_2020_Jan-Aug_daily_C_Afghanistan.pdf for details.}} |date=2020-09-24 |source={{own}} |author=Jochen Burghardt |permission= |other_versions=[[:File:... |
You cannot overwrite this file.
File usage on Commons
There are no pages that use this file.