File:WHO Covid 2020 Jan-Aug daily C Poland.pdf
Jump to navigation
Jump to search

Size of this JPG preview of this PDF file: 800 × 473 pixels. Other resolutions: 320 × 189 pixels | 640 × 378 pixels | 1,024 × 605 pixels | 1,280 × 756 pixels | 3,300 × 1,950 pixels.
Original file (3,300 × 1,950 pixels, file size: 25 KB, MIME type: application/pdf)
Captions
Captions
Add a one-line explanation of what this file represents
Summary
[edit]| Description |
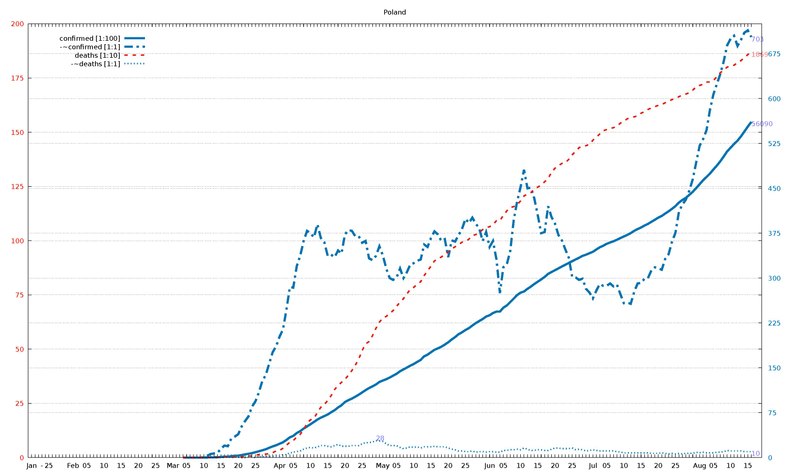
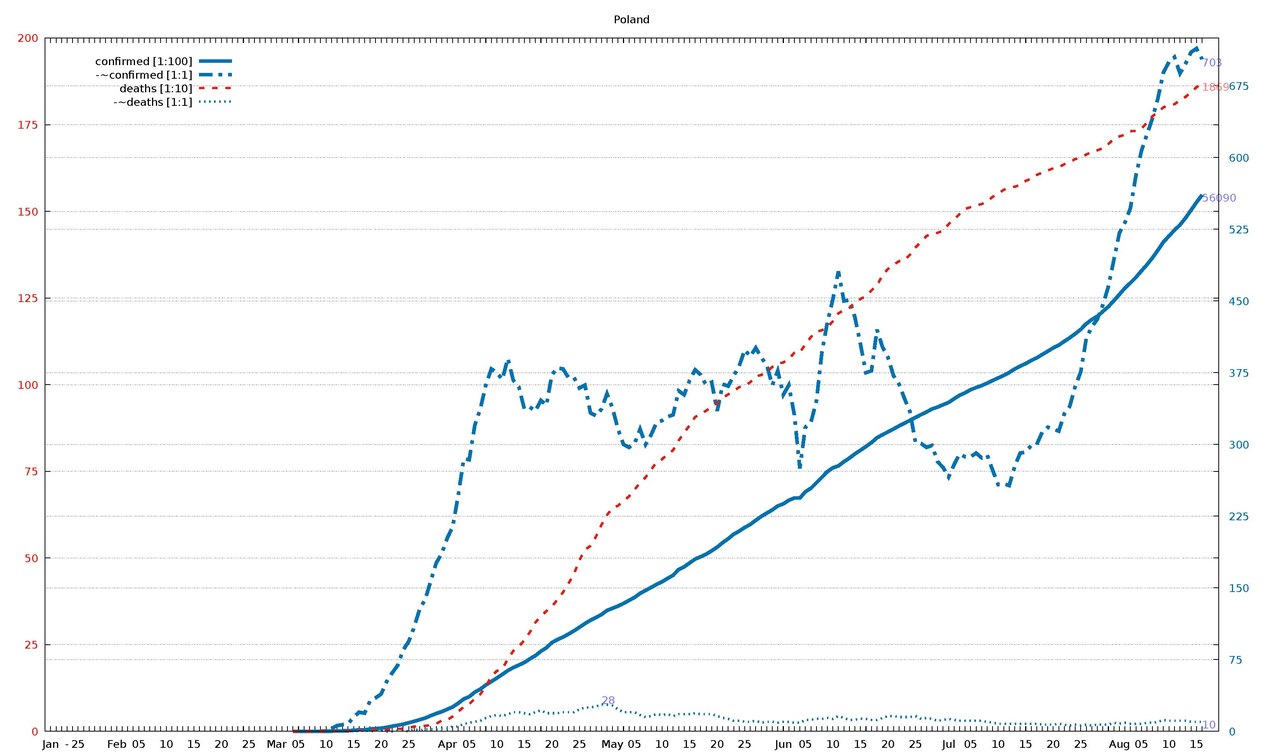
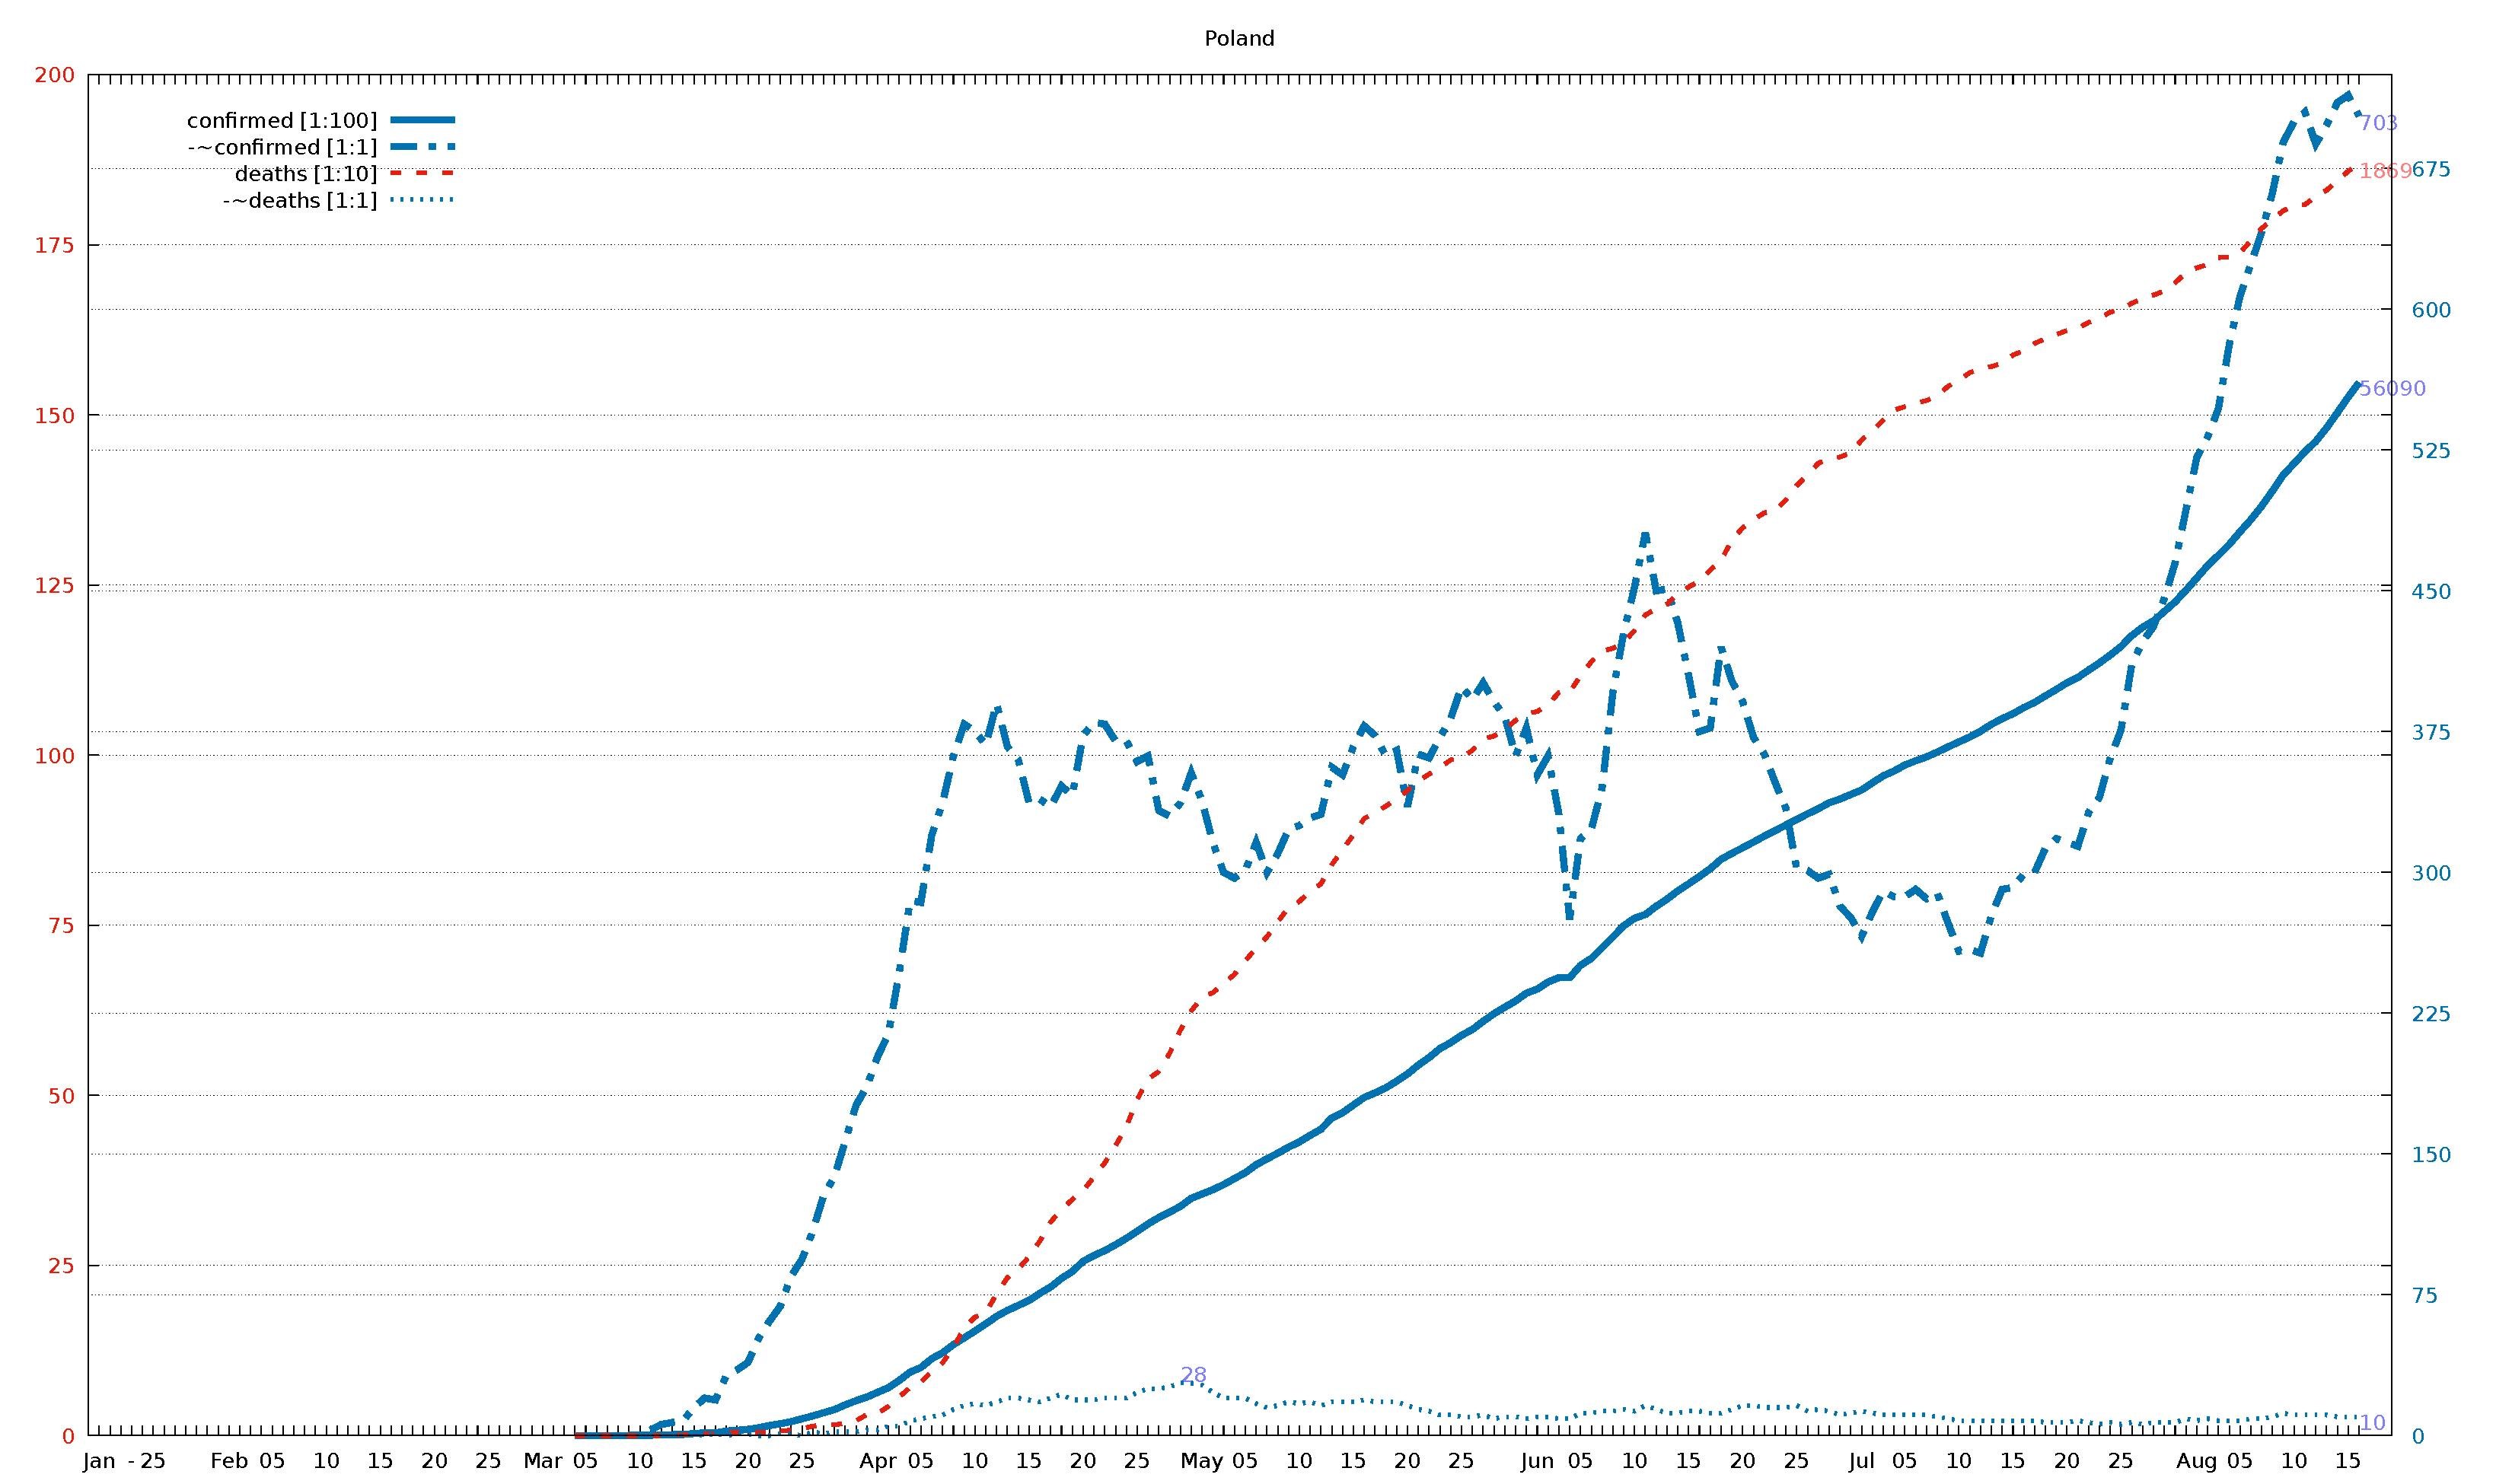
English: Diagram of WHO COVID-19 daily data (20 Jan - 16 Aug 2020) for "Total Confirmed Cases" (thick solid line), its smoothed increment (thick dash-dotted line), "Total Deaths" (thin dashed line) , and its smoothed increment (thin dotted line). Figures are taken from the available situation reports. Red and blue lines refer to the left and right vertical axis, respectively; the scaling factor for each curve is given in the legend. The horizontal axis starts on 20 Jan 2020 (situation report 1), and ends on 16 Aug 2020 (situation report 209). In the smoothed curves, for each day, 1/7 of the difference of the current day's figure and the figure a week ago is shown. For example, in situation report 115 (14 May 2020) and 121 (21 May 2020), there were 8676 and 5339 Total Confirmed Cases in Afghanistan, respectively, so the thick dash-dotted line passes through 477 = (8676-5339)/7 on 21 May.
For an overview of all related visualizations, and a more detailled description, see WHO Covid diagram set#Available country diagrams Jan-Aug 2020 (daily). |
| Date | |
| Source | Own work |
| Author | Jochen Burghardt |
Licensing
[edit]I, the copyright holder of this work, hereby publish it under the following license:
This file is licensed under the Creative Commons Attribution-Share Alike 4.0 International license.
- You are free:
- to share – to copy, distribute and transmit the work
- to remix – to adapt the work
- Under the following conditions:
- attribution – You must give appropriate credit, provide a link to the license, and indicate if changes were made. You may do so in any reasonable manner, but not in any way that suggests the licensor endorses you or your use.
- share alike – If you remix, transform, or build upon the material, you must distribute your contributions under the same or compatible license as the original.
Gnuplot source code
[edit]| Gnuplot source code |
|---|
set term pdf size 22,13
set term pdf font "sans,20"
set output "WHO_Covid_C_Poland.pdf"
set key autotitle columnhead
set termoption noenhanced
# (1) norm: 561 714 187 001
# (2) dist: 1,0:128 2,0:300 2,1:261
# (3,4) dist max: 300 2:187--0:561
# (4) right: 1 1 0 1
# (6,7) scMax: 200 725
# (8) scale: [1:100] [1:1] [1:10] [1:1]


set xrange [-1:212]
set yrange [0:200]
set y2range [0:725]
set xtics 3650,100
set ytics 25 textcolor "#e51e10"
set y2tics 75 textcolor "#0072b2"
set grid y y2

set title "Poland"

$data <<EOF
rep day "confirmed [1:100]" "-~confirmed [1:1]" "deaths [1:10]" "-~deaths [1:1]"
1	Jan	.	-	.	-
2	""	.	-	.	-
3	""	.	-	.	-
-	-	-	-	-	-
4	""	.	-	.	-
5	25	.	-	.	-
6	""	.	-	.	-
7	""	.	-	.	-
8	""	.	-	.	-
9	""	.	-	.	-
10	""	.	-	.	-
11	""	.	-	.	-
12	Feb	.	-	.	-
13	""	.	-	.	-
14	""	.	-	.	-
15	""	.	-	.	-
16	05	.	-	.	-
17	""	.	-	.	-
18	""	.	-	.	-
19	""	.	-	.	-
20	""	.	-	.	-
21	10	.	-	.	-
22	""	.	-	.	-
23	""	.	-	.	-
24	""	.	-	.	-
25	""	.	-	.	-
26	15	.	-	.	-
27	""	.	-	.	-
28	""	.	-	.	-
29	""	.	-	.	-
30	""	.	-	.	-
31	20	.	-	.	-
32	""	.	-	.	-
33	""	.	-	.	-
34	""	.	-	.	-
35	""	.	-	.	-
36	25	.	-	.	-
37	""	.	-	.	-
38	""	.	-	.	-
39	""	.	-	.	-
40	""	.	-	.	-
41	Mar	.	-	.	-
42	""	.	-	.	-
43	""	.	-	.	-
44	""	1	-	0	-
45	05	1	-	0	-
46	""	1	-	0	-
47	""	5	-	0	-
48	""	6	-	0	-
49	""	11	-	0	-
50	10	16	-	0	-
51	""	22	3	0	0
52	""	44	6	0	0
53	""	49	7	1	0
54	""	64	8	1	0
55	15	111	15	3	1
56	""	150	20	3	0
57	""	150	19	3	1
58	""	246	32	5	0
59	""	287	35	5	1
60	20	325	39	5	1
61	""	425	52	5	0
62	""	536	61	5	0
63	""	634	69	7	1
64	""	749	85	8	1
65	25	901	94	10	0
66	""	1051	109	14	2
67	""	1221	128	16	1
68	""	1389	138	16	2
69	""	1638	157	18	2
70	""	1862	176	22	2
71	""	2055	186	31	3
72	Apr	2311	202	33	3
73	""	2554	214	43	5
74	""	2946	247	57	5
75	""	3383	285	71	8
76	05	3627	284	79	9
77	""	4102	320	94	10
78	""	4413	337	107	11
79	""	4848	362	129	14
80	""	5205	379	159	16
81	10	5575	375	174	17
82	""	5955	368	181	16
83	""	6356	390	208	18
84	""	6674	367	232	20
85	""	6934	360	245	20
86	15	7202	337	263	19
87	""	7582	339	286	18
88	""	7918	335	314	20
89	""	8379	346	332	22
90	""	8742	341	347	19
91	20	9287	373	360	19
92	""	9593	380	380	19
93	""	9856	379	401	20
94	""	10169	370	426	20
95	""	10511	370	454	20
96	25	10892	359	494	23
97	""	11273	362	524	25
98	""	11617	333	535	25
99	""	11902	330	562	26
100	""	12218	337	596	28
101	""	12640	353	624	28
102	May	12877	338	644	27
103	""	13105	316	651	23
104	""	13375	300	664	20
105	""	13693	297	678	20
106	05	14006	301	698	20
107	""	14431	316	716	17
108	""	14740	300	733	15
109	""	15047	310	755	16
110	""	15366	323	776	18
111	10	15651	325	785	17
112	""	15996	329	800	18
113	""	16326	331	811	16
114	""	16921	356	839	18
115	""	17204	352	861	18
116	15	17615	367	883	18
117	""	18016	378	907	19
118	""	18257	373	915	18
119	""	18529	362	925	18
120	""	18885	365	936	18
121	20	19268	335	948	16
122	""	19739	363	962	14
123	""	20143	361	972	13
124	""	20619	372	982	11
125	""	20931	382	993	11
126	25	21326	399	996	10
127	""	21631	392	1007	10
128	""	22074	401	1024	11
129	""	22473	391	1028	9
130	""	22825	383	1038	10
131	""	23155	362	1051	10
132	""	23571	377	1061	9
133	Jun	23786	352	1064	10
134	""	24165	362	1074	10
135	""	24395	331	1092	9
136	""	24395	275	1092	9
137	05	25048	318	1117	12
138	""	25419	323	1137	12
139	""	25986	345	1153	13
140	""	26561	396	1157	13
141	""	27160	428	1166	14
142	10	27560	452	1183	13
143	""	27757	481	1206	16
144	""	28201	450	1215	14
145	""	28577	451	1222	12
146	""	29017	433	1237	12
147	15	29392	405	1247	13
148	""	29788	375	1256	13
149	""	30195	377	1272	12
150	""	30701	420	1286	12
151	""	31015	402	1316	14
152	20	31316	391	1334	16
153	""	31620	372	1346	16
154	""	31931	363	1356	15
155	""	32227	348	1359	15
156	""	32527	334	1375	15
157	25	32821	302	1396	16
158	""	33119	301	1412	13
159	""	33395	297	1429	14
160	""	33714	299	1435	13
161	""	33907	282	1438	11
162	""	34154	276	1444	12
163	Jul	34393	266	1463	13
164	""	34775	279	1477	12
165	""	35146	290	1492	11
166	""	35405	287	1507	11
167	05	35719	287	1512	11
168	""	35950	291	1517	11
169	""	36155	286	1521	11
170	""	36412	289	1528	10
171	""	36689	273	1542	9
172	10	36951	258	1551	8
173	""	37216	259	1562	8
174	""	37521	257	1568	8
175	""	37891	277	1571	8
176	""	38190	291	1576	8
177	15	38457	292	1588	8
178	""	38780	299	1594	8
179	""	39054	300	1605	8
180	""	39407	313	1612	7
181	""	39746	318	1618	7
182	20	40104	316	1624	7
183	""	40383	314	1627	8
184	""	40782	332	1636	7
185	""	41162	340	1642	6
186	""	41580	361	1651	7
187	25	42038	376	1655	6
188	""	42622	411	1664	7
189	""	43065	423	1671	6
190	""	43402	431	1676	7
191	""	43904	446	1682	7
192	""	44416	465	1694	7
193	""	45031	493	1709	9
194	Aug	45688	521	1716	8
195	""	46346	532	1721	9
196	""	46894	547	1731	8
197	""	47469	581	1732	8
198	05	48149	607	1738	8
199	""	48789	624	1756	9
200	""	49515	641	1774	9
201	""	50324	662	1787	10
202	""	51167	689	1800	12
203	10	51791	700	1807	11
204	""	52410	705	1809	11
205	""	52961	688	1821	11
206	""	53676	698	1830	11
207	""	54487	710	1844	10
208	15	55319	714	1858	10
209	""	56090	703	1869	10
EOF

# confirmed:
set label "56090  " at first 209,560*200/725   left back textcolor "#8080ff"
# -~confirmed:
set label "703    " at first 209,703*200/725   left back textcolor "#8080ff"
# deaths:
set label "1869   " at first 209,186           left back textcolor "#ff8080"
# -~deaths:
set label "10     " at first 209, 10*200/725   left back textcolor "#8080ff"
set label "28     " at first 100, 28*200/725+2 left back textcolor "#8080ff"

set multiplot
  plot $data using 0:($3/    100*200/725) with lines lc 6 lw 8 dt 1 title at 0.150, 0.920
replot $data using 0:($4/      1*200/725) with lines lc 6 lw 8 dt 4 title at 0.150, 0.902
replot $data using 0:($5/     10        ) with lines lc 7 lw 5 dt 2 title at 0.150, 0.884
replot $data using 0:($6/      1*200/725) with lines lc 6 lw 5 dt 3 title at 0.150, 0.866

# plot hor axis calendar
replot $data using 0:(0):xticlabel(2) with lines
|
File history
Click on a date/time to view the file as it appeared at that time.
| Date/Time | Thumbnail | Dimensions | User | Comment | |
|---|---|---|---|---|---|
| current | 19:30, 24 September 2020 |  | 3,300 × 1,950 (25 KB) | Jochen Burghardt (talk | contribs) | =={{int:filedesc}}== {{Information |description={{en|1=Diagram of WHO COVID-19 daily data (20 Jan - 16 Aug 2020) for ''"Total Confirmed Cases"'' (thick solid line), its smoothed increment (thick dash-dotted line), ''"Total Deaths"'' (thin dashed line), and its smoothed increment (thin dotted line); see File:WHO_Covid_2020_Jan-Aug_daily_C_Afghanistan.pdf for details.}} |date=2020-09-24 |source={{own}} |author=Jochen Burghardt |permission= |other_versions=[[:File:... |
You cannot overwrite this file.
File usage on Commons
There are no pages that use this file.