File:WHO Covid 2020 Jan-Aug daily C Sri Lanka.pdf
Jump to navigation
Jump to search

Size of this JPG preview of this PDF file: 800 × 473 pixels. Other resolutions: 320 × 189 pixels | 640 × 378 pixels | 1,024 × 605 pixels | 1,280 × 756 pixels | 3,300 × 1,950 pixels.
Original file (3,300 × 1,950 pixels, file size: 21 KB, MIME type: application/pdf)
Captions
Captions
Add a one-line explanation of what this file represents
Summary
[edit]| Description |
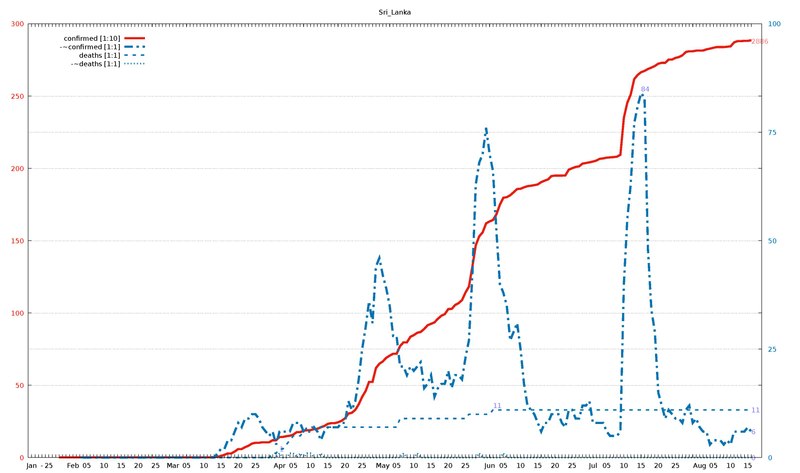
English: Diagram of WHO COVID-19 daily data (20 Jan - 16 Aug 2020) for "Total Confirmed Cases" (thick solid line), its smoothed increment (thick dash-dotted line), "Total Deaths" (thin dashed line) , and its smoothed increment (thin dotted line). Figures are taken from the available situation reports. Red and blue lines refer to the left and right vertical axis, respectively; the scaling factor for each curve is given in the legend. The horizontal axis starts on 20 Jan 2020 (situation report 1), and ends on 16 Aug 2020 (situation report 209). In the smoothed curves, for each day, 1/7 of the difference of the current day's figure and the figure a week ago is shown. For example, in situation report 115 (14 May 2020) and 121 (21 May 2020), there were 8676 and 5339 Total Confirmed Cases in Afghanistan, respectively, so the thick dash-dotted line passes through 477 = (8676-5339)/7 on 21 May.
For an overview of all related visualizations, and a more detailled description, see WHO Covid diagram set#Available country diagrams Jan-Aug 2020 (daily). |
| Date | |
| Source | Own work |
| Author | Jochen Burghardt |
Licensing
[edit]I, the copyright holder of this work, hereby publish it under the following license:
This file is licensed under the Creative Commons Attribution-Share Alike 4.0 International license.
- You are free:
- to share – to copy, distribute and transmit the work
- to remix – to adapt the work
- Under the following conditions:
- attribution – You must give appropriate credit, provide a link to the license, and indicate if changes were made. You may do so in any reasonable manner, but not in any way that suggests the licensor endorses you or your use.
- share alike – If you remix, transform, or build upon the material, you must distribute your contributions under the same or compatible license as the original.
Gnuplot source code
[edit]| Gnuplot source code |
|---|
set term pdf size 22,13
set term pdf font "sans,20"
set output "WHO_Covid_C_Sri_Lanka.pdf"
set key autotitle columnhead
set termoption noenhanced
# (1) norm: 289 001 001 001

set xrange [-1:212]
set yrange [0:300]
set y2range [0:100]
set xtics 3650,100
set ytics 50 textcolor "#e51e10"
set y2tics 25 textcolor "#0072b2"
set grid y y2

set title "Sri_Lanka"

$data <<EOF
rep day "confirmed [1:10]" "-~confirmed [1:1]" "deaths [1:1]" "-~deaths [1:1]"
1	Jan	.	-	.	-
2	""	.	-	.	-
3	""	.	-	.	-
-	-	-	-	-	-
4	""	.	-	.	-
5	25	.	-	.	-
6	""	.	-	.	-
7	""	.	-	.	-
8	""	1	-	.	-
9	""	1	-	.	-
10	""	1	-	.	-
11	""	1	-	.	-
12	Feb	1	-	.	-
13	""	1	-	.	-
14	""	1	-	0	-
15	""	1	0	0	-
16	05	1	0	0	-
17	""	1	0	0	-
18	""	1	0	0	-
19	""	1	0	0	-
20	""	1	0	0	-
21	10	1	0	0	0
22	""	1	0	0	0
23	""	1	0	0	0
24	""	1	0	0	0
25	""	1	0	0	0
26	15	1	0	0	0
27	""	1	0	0	0
28	""	1	0	0	0
29	""	1	0	0	0
30	""	1	0	0	0
31	20	1	0	0	0
32	""	1	0	0	0
33	""	1	0	0	0
34	""	1	0	0	0
35	""	1	0	0	0
36	25	1	0	0	0
37	""	1	0	0	0
38	""	1	0	0	0
39	""	1	0	0	0
40	""	1	0	0	0
41	Mar	1	0	0	0
42	""	1	0	0	0
43	""	1	0	0	0
44	""	1	0	0	0
45	05	1	0	0	0
46	""	1	0	0	0
47	""	1	0	0	0
48	""	1	0	0	0
49	""	1	0	0	0
50	10	1	0	0	0
51	""	1	0	0	0
52	""	2	0	0	0
53	""	3	0	0	0
54	""	6	1	0	0
55	15	11	2	0	0
56	""	19	2	0	0
57	""	29	4	0	0
58	""	29	4	0	0
59	""	42	6	0	0
60	20	59	8	0	0
61	""	59	7	0	0
62	""	72	9	0	0
63	""	82	9	0	0
64	""	97	10	0	0
65	25	102	10	0	0
66	""	102	9	0	0
67	""	106	7	0	0
68	""	106	6	0	0
69	""	106	5	0	0
70	""	120	6	1	0
71	""	120	3	1	0
72	Apr	143	6	2	1
73	""	143	6	2	0
74	""	148	6	3	0
75	""	151	6	4	1
76	05	159	8	5	1
77	""	176	8	5	0
78	""	176	8	5	1
79	""	186	6	6	0
80	""	189	6	7	1
81	10	190	6	7	1
82	""	197	7	7	0
83	""	199	6	7	0
84	""	210	4	7	1
85	""	218	6	7	0
86	15	233	7	7	0
87	""	238	7	7	0
88	""	238	7	7	0
89	""	244	7	7	0
90	""	254	8	7	0
91	20	271	8	7	0
92	""	304	13	7	0
93	""	310	11	7	0
94	""	330	13	7	0
95	""	368	18	7	0
96	25	420	25	7	0
97	""	460	30	7	0
98	""	523	36	7	0
99	""	523	31	7	0
100	""	619	44	7	0
101	""	649	46	7	0
102	May	665	42	7	0
103	""	690	39	7	0
104	""	705	35	7	0
105	""	718	28	7	0
106	05	718	28	7	0
107	""	771	21	9	0
108	""	797	21	9	1
109	""	797	19	9	0
110	""	835	21	9	0
111	10	847	20	9	0
112	""	863	21	9	1
113	""	869	22	9	0
114	""	889	16	9	0
115	""	915	17	9	0
116	15	925	19	9	0
117	""	935	14	9	0
118	""	960	16	9	0
119	""	981	17	9	0
120	""	992	17	9	0
121	20	1027	20	9	0
122	""	1028	16	9	0
123	""	1055	19	9	0
124	""	1068	19	9	0
125	""	1089	18	9	0
126	25	1141	23	9	0
127	""	1182	27	10	0
128	""	1319	42	10	0
129	""	1469	63	10	0
130	""	1530	68	10	1
131	""	1558	70	10	0
132	""	1620	76	10	0
133	Jun	1633	70	10	0
134	""	1643	66	11	0
135	""	1683	52	11	0
136	""	1749	40	11	0
137	05	1797	38	11	1
138	""	1801	35	11	0
139	""	1814	27	11	0
140	""	1835	29	11	0
141	""	1857	31	11	0
142	10	1859	25	11	0
143	""	1869	17	11	0
144	""	1877	12	11	0
145	""	1880	11	11	0
146	""	1884	10	11	0
147	15	1889	8	11	0
148	""	1905	6	11	0
149	""	1915	8	11	0
150	""	1924	8	11	0
151	""	1947	10	11	0
152	20	1950	10	11	0
153	""	1950	10	11	0
154	""	1950	8	11	0
155	""	1951	7	11	0
156	""	1991	11	11	0
157	25	2001	11	11	0
158	""	2010	9	11	0
159	""	2014	9	11	0
160	""	2033	12	11	0
161	""	2037	12	11	0
162	""	2042	13	11	0
163	Jul	2047	8	11	0
164	""	2054	8	11	0
165	""	2066	8	11	0
166	""	2069	8	11	0
167	05	2074	6	11	0
168	""	2076	5	11	0
169	""	2078	5	11	0
170	""	2081	5	11	0
171	""	2094	6	11	0
172	10	2350	40	11	0
173	""	2454	55	11	0
174	""	2511	63	11	0
175	""	2617	77	11	0
176	""	2646	81	11	0
177	15	2665	84	11	0
178	""	2674	83	11	0
179	""	2687	48	11	0
180	""	2697	34	11	0
181	""	2708	29	11	0
182	20	2724	15	11	0
183	""	2730	12	11	0
184	""	2730	9	11	0
185	""	2752	11	11	0
186	""	2753	10	11	0
187	25	2764	9	11	0
188	""	2770	9	11	0
189	""	2782	8	11	0
190	""	2805	11	11	0
191	""	2810	12	11	0
192	""	2810	8	11	0
193	""	2814	9	11	0
194	Aug	2815	7	11	0
195	""	2815	6	11	0
196	""	2823	6	11	0
197	""	2828	3	11	0
198	05	2834	4	11	0
199	""	2839	4	11	0
200	""	2839	4	11	0
201	""	2839	3	11	0
202	""	2841	4	11	0
203	10	2844	3	11	0
204	""	2871	6	11	0
205	""	2880	6	11	0
206	""	2880	6	11	0
207	""	2882	6	11	0
208	15	2882	7	11	0
209	""	2886	6	11	0
EOF

# confirmed:
set label "2886   " at first 209,288           left back textcolor "#ff8080"
# -~confirmed:
set label "6      " at first 209,  6*300/100   left back textcolor "#8080ff"
set label "84     " at first 177, 84*300/100+3 left back textcolor "#8080ff"
# deaths:
set label "11     " at first 209, 11*300/100   left back textcolor "#8080ff"
set label "11     " at first 134, 11*300/100+3 left back textcolor "#8080ff"
# -~deaths:
set label "0      " at first 209,  0*300/100   left back textcolor "#8080ff"
set label "1      " at first  72,  1*300/100+3 left back textcolor "#8080ff"

set multiplot
  plot $data using 0:($3/     10        ) with lines lc 7 lw 8 dt 1 title at 0.150, 0.920
replot $data using 0:($4/      1*300/100) with lines lc 6 lw 8 dt 4 title at 0.150, 0.902
replot $data using 0:($5/      1*300/100) with lines lc 6 lw 5 dt 2 title at 0.150, 0.884
replot $data using 0:($6/      1*300/100) with lines lc 6 lw 5 dt 3 title at 0.150, 0.866

# plot hor axis calendar
replot $data using 0:(0):xticlabel(2) with lines
|
File history
Click on a date/time to view the file as it appeared at that time.
| Date/Time | Thumbnail | Dimensions | User | Comment | |
|---|---|---|---|---|---|
| current | 19:37, 24 September 2020 |  | 3,300 × 1,950 (21 KB) | Jochen Burghardt (talk | contribs) | =={{int:filedesc}}== {{Information |description={{en|1=Diagram of WHO COVID-19 daily data (20 Jan - 16 Aug 2020) for ''"Total Confirmed Cases"'' (thick solid line), its smoothed increment (thick dash-dotted line), ''"Total Deaths"'' (thin dashed line), and its smoothed increment (thin dotted line); see File:WHO_Covid_2020_Jan-Aug_daily_C_Afghanistan.pdf for details.}} |date=2020-09-24 |source={{own}} |author=Jochen Burghardt |permission= |other_versions=[[:File:... |
You cannot overwrite this file.
File usage on Commons
There are no pages that use this file.