File:WHO Covid C Gansu.pdf
Jump to navigation
Jump to search

Size of this JPG preview of this PDF file: 800 × 473 pixels. Other resolutions: 320 × 189 pixels | 640 × 378 pixels | 1,024 × 605 pixels | 1,280 × 756 pixels | 3,300 × 1,950 pixels.
Original file (3,300 × 1,950 pixels, file size: 15 KB, MIME type: application/pdf)
Captions
Captions
Add a one-line explanation of what this file represents
Summary[edit]
| Description |
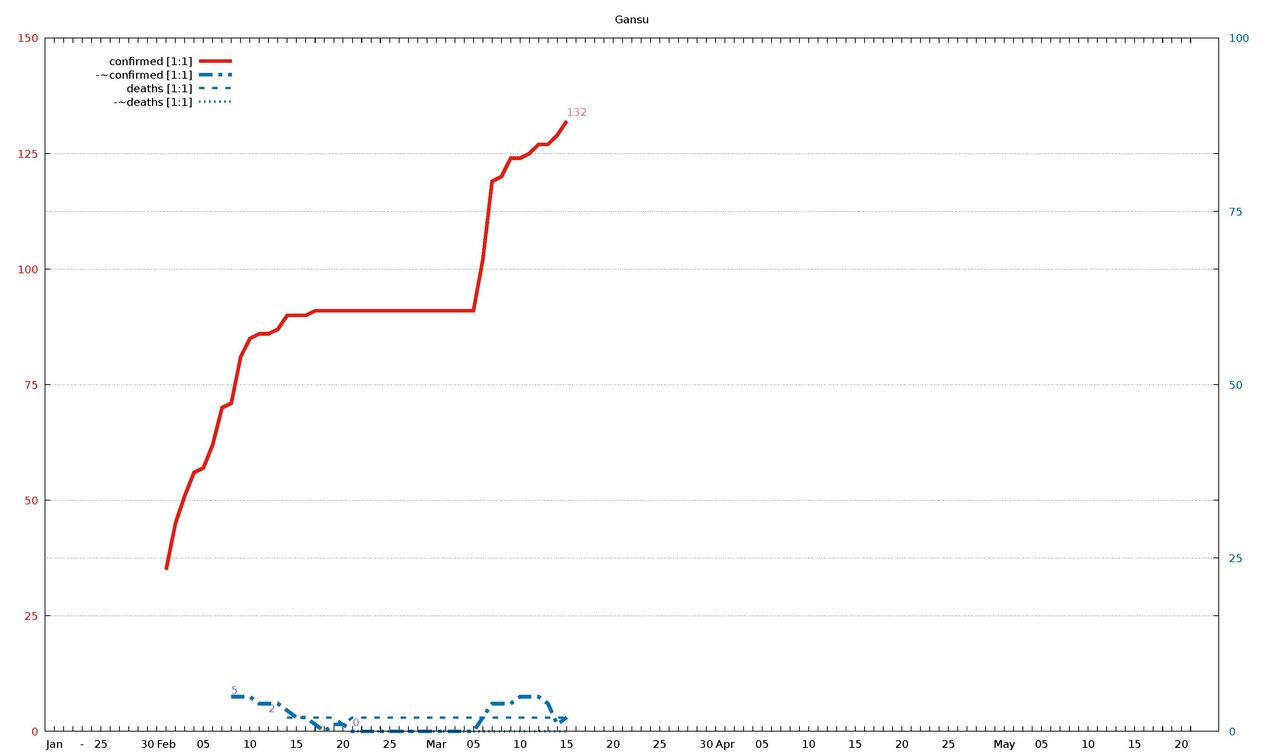
English: Diagram of WHO COVID-19 data for "Total Confirmed Cases" (thick solid line), its increment (thick dash-dotted line), "Total Deaths" (thin dashed line), and its increment (thin dotted line). Figures are taken from the available Weekly Epidemiological Updates (16 Aug 2020 - 13 Jun 2021), supplemented by Sundays' situation reports (26 Jan - 16 Aug 2020). Red and blue lines refer to the left and right vertical axis, respectively. The scaling factor for each curve is given in the legend. The horizontal axis starts on 26 Jan 2020 (Situation Report 1) and ends on 13 Jun 2021 (Weekly Epidemiological Update 44); later WHO reports omit detailled figures.
For an overview of all related visualizations, and a more detailled description, including gnuplot source code, see WHO Covid diagram set#Available up-to-date country diagrams (weekly). |
| Date | |
| Source | Own work |
| Author | Jochen Burghardt |
Licensing[edit]
I, the copyright holder of this work, hereby publish it under the following license:
This file is licensed under the Creative Commons Attribution-Share Alike 4.0 International license.
- You are free:
- to share – to copy, distribute and transmit the work
- to remix – to adapt the work
- Under the following conditions:
- attribution – You must give appropriate credit, provide a link to the license, and indicate if changes were made. You may do so in any reasonable manner, but not in any way that suggests the licensor endorses you or your use.
- share alike – If you remix, transform, or build upon the material, you must distribute your contributions under the same or compatible license as the original.
File history
Click on a date/time to view the file as it appeared at that time.
| Date/Time | Thumbnail | Dimensions | User | Comment | |
|---|---|---|---|---|---|
| current | 12:02, 22 May 2020 |  | 3,300 × 1,950 (15 KB) | Jochen Burghardt (talk | contribs) | =={{int:filedesc}}== {{Information |description={{en|1=Diagram of WHO COVID-19 data for ''"Total Confirmed Cases"'' (thick solid line), its smoothed increment (thick dash-dotted line), ''"Total Deaths"'' (thin dashed line) , and its smoothed increment (thin dotted line); see File:WHO Covid C Afghanistan.pdf for details.}} |date=2020-05-22 |source={{own}} |author=Jochen Burghardt |permission= |other_versions=File:WHO_Covid_C_Afghanistan.pdf * [[:File:WHO_Co... |
You cannot overwrite this file.
File usage on Commons
There are no pages that use this file.