File:World map of prison population rates from World Prison Brief.svg
跳至導覽
跳至搜尋

此 SVG 檔案的 PNG 預覽的大小:800 × 565 像素。 其他解析度:320 × 226 像素 | 640 × 452 像素 | 1,024 × 723 像素 | 1,280 × 904 像素 | 2,560 × 1,807 像素。
原始檔案 (SVG 檔案,表面大小:850 × 600 像素,檔案大小:164 KB)
說明
說明
添加單行說明來描述出檔案所代表的內容
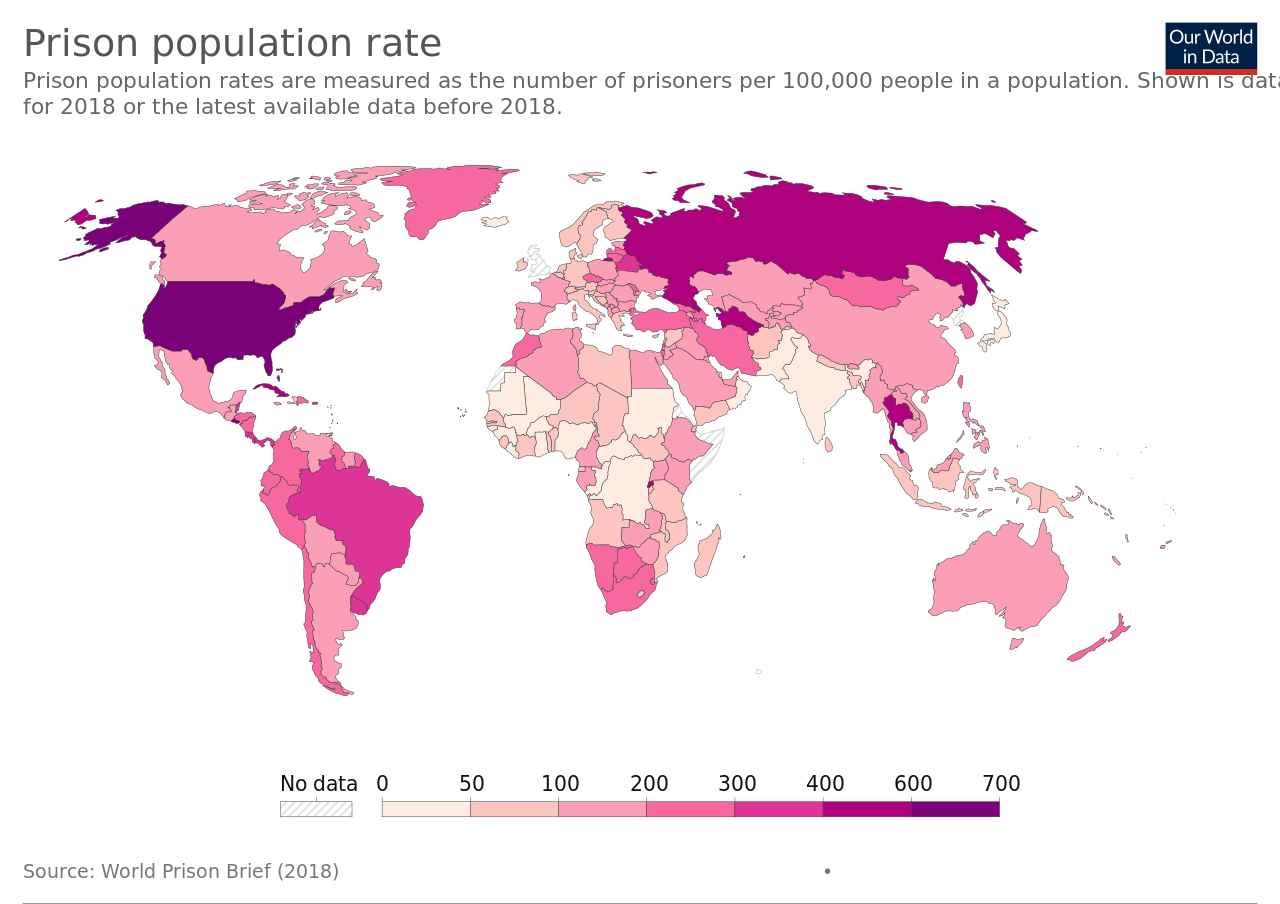
World map of prison population rates from World Prison Brief.
摘要[編輯]
| 描述 |
English: World map of prison population rates from World Prison Brief. See the date on the map. Rate is per 100,000 of national population. For the exact numbers click on the source link below and then go to the table tab. See also: List of countries by incarceration rate. |
| 日期 | is the date of the first upload to the Commons. See the file history below for the most recent upload date. |
| 來源 | https://ourworldindata.org/grapher/prison-population-rate - Click on the download tab to download map. The table tab has a table of the exact data by country. The map at the source is interactive and provides much more detail. For example, run your cursor over the color bar legend to see the countries that apply to that point in the legend. |
| 作者 | Our World In Data. See English Wikipedia: Our World in Data. |
| SVG開發 |
授權條款[編輯]
此檔案採用創用CC 姓名標示 4.0 國際授權條款。
- 您可以自由:
- 分享 – 複製、發佈和傳播本作品
- 重新修改 – 創作演繹作品
- 惟需遵照下列條件:
- 姓名標示 – 您必須指名出正確的製作者,和提供授權條款的連結,以及表示是否有對內容上做出變更。您可以用任何合理的方式來行動,但不得以任何方式表明授權條款是對您許可或是由您所使用。
檔案歷史
點選日期/時間以檢視該時間的檔案版本。
| 日期/時間 | 縮圖 | 尺寸 | 用戶 | 備註 | |
|---|---|---|---|---|---|
| 目前 | 2023年7月27日 (四) 10:14 | | 850 × 600(164 KB) | Timeshifter(對話 | 貢獻) | Map has been slightly updated |
| 2022年8月2日 (二) 20:09 |  | 850 × 600(151 KB) | Andrew Pertsev(對話 | 貢獻) | Fix svg errors | |
| 2021年5月15日 (六) 19:20 |  | 850 × 600(168 KB) | Timeshifter(對話 | 貢獻) | Uploaded a work by Our World in Data from https://ourworldindata.org/grapher/prison-population-rate with UploadWizard |
無法覆蓋此檔案。
檔案用途
沒有使用此檔案的頁面。
全域檔案使用狀況
以下其他 wiki 使用了這個檔案:
- ar.wikipedia.org 的使用狀況
- bg.wikipedia.org 的使用狀況
- de.wikipedia.org 的使用狀況
- en.wikipedia.org 的使用狀況
- Human rights in Uzbekistan
- Incarceration in the United States
- Prison
- List of countries by incarceration rate
- Prisons in Turkey
- Federal Penitentiary Service
- Prisons in Russia
- Comparison of United States incarceration rate with other countries
- Department of Corrections (Thailand)
- Judicial system of the Islamic Republic of Iran
- en.wikibooks.org 的使用狀況
- es.wikipedia.org 的使用狀況
- fa.wikipedia.org 的使用狀況
- fr.wikipedia.org 的使用狀況
- hi.wikipedia.org 的使用狀況
- ja.wikipedia.org 的使用狀況
- ka.wikipedia.org 的使用狀況
- ru.wikipedia.org 的使用狀況
- simple.wikipedia.org 的使用狀況
- sr.wikipedia.org 的使用狀況
- zh.wikipedia.org 的使用狀況