File:GISS temperature 2000-09 lrg.png
Bước tới điều hướng
Bước tới tìm kiếm

Kích thước hình xem trước: 800×400 điểm ảnh. Độ phân giải khác: 320×160 điểm ảnh | 640×320 điểm ảnh | 1.024×512 điểm ảnh | 1.280×640 điểm ảnh | 2.880×1.440 điểm ảnh.
Tập tin gốc (2.880×1.440 điểm ảnh, kích thước tập tin: 545 kB, kiểu MIME: image/png)
Chú thích
Chú thích
Ghi một dòng giải thích những gì có trong tập tin này
Miêu tả[sửa]
| Miêu tả |
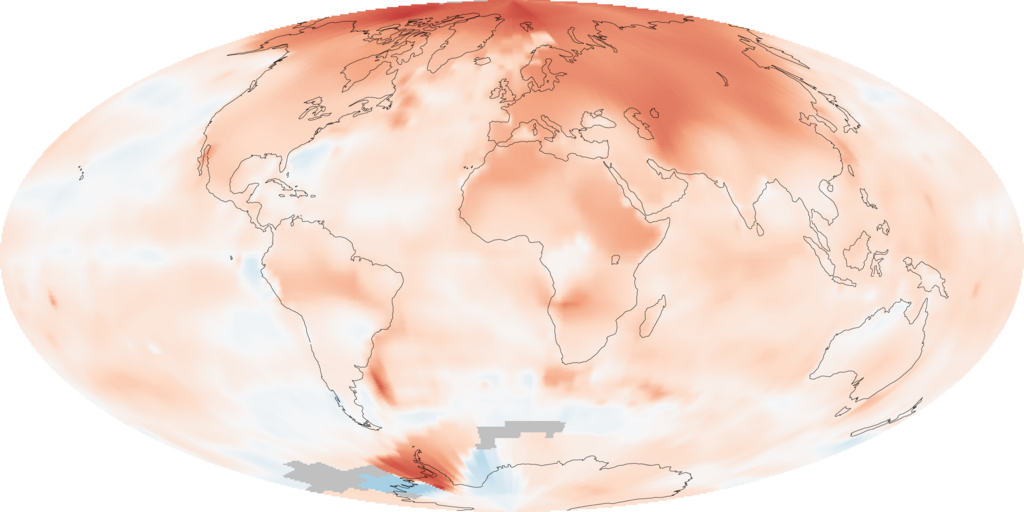
English: The map illustrates just how much warmer temperatures were in the decade (2000-2009) compared to average temperatures recorded between 1951 and 1980 (a common reference period for climate studies). The most extreme warming, shown in red, was in the Arctic. Very few areas saw cooler than average temperatures, shown in blue. Gray areas over parts of the Southern Ocean are places where temperatures were not recorded. The analysis, conducted by the Goddard Institute for Space Studies (GISS) in New York City, is based on temperatures recorded at meteorological (weather) stations around the world and satellite data over the oceans.
|
| Ngày | |
| Nguồn gốc | NASA Earth Observatory Image of the Day: 2009 Ends Warmest Decade on Record http://earthobservatory.nasa.gov/IOTD/view.php?id=42392 |
| Tác giả | NASA images by Robert Simmon, based on data from the Goddard Institute for Space Studies. |
Giấy phép[sửa]
| This file is in the public domain in the United States because it was solely created by NASA. NASA copyright policy states that "NASA material is not protected by copyright unless noted". (See Template:PD-USGov, NASA copyright policy page or JPL Image Use Policy.) | ||
 |
Warnings:
|
Lịch sử tập tin
Nhấn vào ngày/giờ để xem nội dung tập tin tại thời điểm đó.
| Ngày/Giờ | Hình xem trước | Kích cỡ | Thành viên | Miêu tả | |
|---|---|---|---|---|---|
| hiện tại | 03:09, ngày 23 tháng 1 năm 2010 | | 2.880×1.440 (545 kB) | Petersam (thảo luận | đóng góp) | {{Information |Description={{en|1=The map illustrate just how much warmer temperatures were in the decade (2000-2009) compared to average temperatures recorded between 1951 and 1980 (a common reference period for climate studies). The most extreme warming |
Bạn không được phép ghi đè tập tin này.
Trang sử dụng tập tin
Không có trang nào sử dụng tập tin này.
Sử dụng tập tin toàn cục
Những wiki sau đang sử dụng tập tin này:
- Trang sử dụng tại ar.wikipedia.org
- Trang sử dụng tại as.wikipedia.org
- Trang sử dụng tại bn.wikipedia.org
- Trang sử dụng tại bxr.wikipedia.org
- Trang sử dụng tại cs.wikipedia.org
- Trang sử dụng tại en.wikipedia.org
- Trang sử dụng tại en.wikiversity.org
- Trang sử dụng tại es.wikipedia.org
- Trang sử dụng tại fa.wikipedia.org
- Trang sử dụng tại fr.wikipedia.org
- Trang sử dụng tại id.wikipedia.org
- Trang sử dụng tại ilo.wikipedia.org
- Trang sử dụng tại it.wikipedia.org
- Trang sử dụng tại ko.wikipedia.org
- Trang sử dụng tại or.wikipedia.org
- Trang sử dụng tại pnb.wikipedia.org
- Trang sử dụng tại pt.wikipedia.org
- Trang sử dụng tại pt.wikinews.org
- Trang sử dụng tại si.wikipedia.org
- Trang sử dụng tại sv.wikipedia.org
- Trang sử dụng tại uk.wikipedia.org
- Trang sử dụng tại vi.wikipedia.org
- Trang sử dụng tại www.wikidata.org
- Trang sử dụng tại zh.wikipedia.org