File:Variance visualisation.svg
Jump to navigation
Jump to search

Size of this PNG preview of this SVG file: 375 × 600 pixels. Other resolutions: 150 × 240 pixels | 300 × 480 pixels | 480 × 768 pixels | 640 × 1,024 pixels | 1,280 × 2,048 pixels | 512 × 819 pixels.
Original file (SVG file, nominally 512 × 819 pixels, file size: 5 KB)
Captions
Captions
Add a one-line explanation of what this file represents
Summary[edit]
| Description |
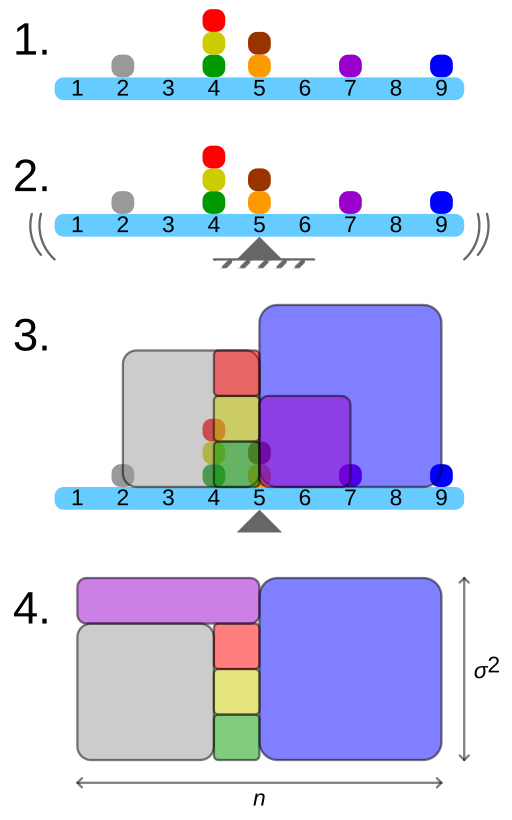
English: Geometric visualisation of the variance of the example distribution (2, 4, 4, 4, 5, 5, 7, 9) on w:Standard deviation.
1. A frequency distribution is constructed. 2. The centroid of the distribution gives its mean. 3. A square with sides equal to the difference of each value from the mean is formed for each value. 4. Arranging the squares into a rectangle with one side equal to the number of values (n) results in the other side being equal to the variance of the distribution (σ²). |
| Source | Own work |
| Author | Cmglee |
Licensing[edit]
I, the copyright holder of this work, hereby publish it under the following licenses:
This file is licensed under the Creative Commons Attribution-Share Alike 3.0 Unported license.
- You are free:
- to share – to copy, distribute and transmit the work
- to remix – to adapt the work
- Under the following conditions:
- attribution – You must give appropriate credit, provide a link to the license, and indicate if changes were made. You may do so in any reasonable manner, but not in any way that suggests the licensor endorses you or your use.
- share alike – If you remix, transform, or build upon the material, you must distribute your contributions under the same or compatible license as the original.

|
Permission is granted to copy, distribute and/or modify this document under the terms of the GNU Free Documentation License, Version 1.2 or any later version published by the Free Software Foundation; with no Invariant Sections, no Front-Cover Texts, and no Back-Cover Texts. A copy of the license is included in the section entitled GNU Free Documentation License. |
You may select the license of your choice.
File history
Click on a date/time to view the file as it appeared at that time.
| Date/Time | Thumbnail | Dimensions | User | Comment | |
|---|---|---|---|---|---|
| current | 20:59, 8 April 2015 | | 512 × 819 (5 KB) | Cmglee (talk | contribs) | {{Information |Description ={{en|1=Geometric visualisation of the variance of the example distribution (2, 4, 4, 4, 5, 5, 7, 9) on w:Standard deviation. 1. A frequency distribution is constructed. 2. The centroid of the distribution gives its... |
You cannot overwrite this file.
File usage on Commons
The following page uses this file:
File usage on other wikis
The following other wikis use this file:
- Usage on ca.wikipedia.org
- Usage on el.wikipedia.org
- Usage on en.wikipedia.org
- Usage on es.wikipedia.org
- Usage on pt.wikipedia.org
- Usage on ro.wikipedia.org
- Usage on uk.wikipedia.org