Category:1850 maps of Europe
Jump to navigation
Jump to search
Temperate regions: North America · South America · Africa · Europe · Asia · – Polar regions: – Other regions:
| ← 1850 1851 1852 1853 1854 1855 1856 1857 1858 1859 → |
English: 1850 maps of Europe
Español: Mapas de Europa en 1850
Suomi: Euroopan kartat vuodelta 1850
Română: Hărți ale Europei din 1850
Subcategories
This category has the following 11 subcategories, out of 11 total.
.
F
- 1850 maps of France (23 F)
G
I
- 1850 maps of Italy (2 F)
N
- 1850 maps of Norway (9 F)
R
- 1850 maps of Russia (3 F)
S
- 1850 maps of Spain (9 F)
- 1850 maps of Switzerland (29 F)
T
- 1850 maps of Turkey (4 F)
U
Media in category "1850 maps of Europe"
The following 7 files are in this category, out of 7 total.
-
 1850 Mitchell Map of Europe - Geographicus - Europe-mitchell-1850.jpg 3,500 × 2,788; 3.12 MB
-
 Atlas turc - F. de Brocktorff, del - btv1b84432795 (11 of 11).jpg 7,704 × 5,021; 4.35 MB
-

-
 Atlas éthiopien - L. de Brocktorff, fec. - btv1b8443278r (1 of 7).jpg 7,102 × 5,374; 5.07 MB
-
 Deutsche Herbstkrise 1850 Karte.svg 880 × 889; 2.16 MB
-

-
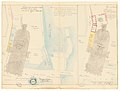 Plan des abords de la cathédrale de Quimper (1850) - Archives nationales (France).jpg 3,948 × 2,985; 1.16 MB

.jpg)
_-_Geographicus_-_RomeDivided-spruneri-1850.jpg)
.jpg)


_-_Archives_nationales_(France).jpg)