Category:Atmospheric circulation
Jump to navigation
Jump to search
large-scale movement of air, a means by which thermal energy is distributed on Earth's surface | |||||
| Upload media | |||||
| Subclass of |
| ||||
|---|---|---|---|---|---|
| Facet of | |||||
| |||||
Subcategories
This category has the following 33 subcategories, out of 33 total.
A
B
C
- Cold air damming (7 F)
E
H
- Hadley cells (6 F)
I
- Invierno altiplánico (12 F)
- Isallobars (4 F)
- Isentropic analysis (9 F)
J
- Jet streams (45 F)
L
M
O
- Arctic oscillation (22 F)
- Madden-Julian Oscillation (1 P, 6 F)
- North Atlantic Oscillation (17 F)
P
Q
- Quasi-biennial oscillation (3 F)
R
- Rossby waves (20 F)
S
T
U
W
- Walker circulation (28 F)
Pages in category "Atmospheric circulation"
The following 2 pages are in this category, out of 2 total.
Media in category "Atmospheric circulation"
The following 55 files are in this category, out of 55 total.
-
 Balance flow speeds.PNG 954 × 674; 47 KB
-
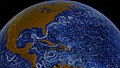
CCMP Winds from June through October 2011.ogv 4 min 6 s, 1,920 × 1,080; 32.56 MB
-
 Centros de acción.png 596 × 381; 6 KB
-
 Ciclo hidrologico.svg 406 × 292; 174 KB
-
 Ciclo hidrologico1.jpg 406 × 292; 56 KB
-
 Circulation Dry line fr.svg 512 × 205; 2 KB
-
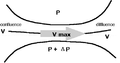
 Col barométrique.svg 1,050 × 1,130; 20 KB
-
 Confluence-Diffluence fr.svg 1,151 × 753; 22 KB
-
 Confluence-Diffluence.png 496 × 259; 21 KB
-
 Convergence zones.jpg 924 × 541; 162 KB
-
-
 Crête et creux barométriques d'altitude.jpg 800 × 600; 57 KB
-
 EddyCovariance diagram 2 es.png 600 × 205; 118 KB
-
 EddyCovariance diagram 2.jpg 600 × 205; 19 KB
-
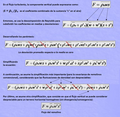 EddyCovariance equations es.png 1,698 × 1,661; 1.26 MB
-
 FMIB 36723 Planisphere des Vents Oceaniques du Mois de Juillet.jpeg 1,227 × 912; 399 KB
-
 FMIB 36736 Planisphere des Vents Oceaniques du Mois de Janvier.jpeg 1,227 × 878; 394 KB
-
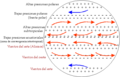
 FMIB 36741 Planisphere Montrant les Principaux Centres d'Action Atmospherique.jpeg 1,554 × 1,071; 514 KB
-
 FMIB 36742 Courants Atmospheriques.jpeg 1,558 × 2,216; 1,006 KB
-
 High and low pressure N and S.svg 1,050 × 1,130; 22 KB
-
 Lorenz Energy Cycle.png 1,102 × 826; 104 KB
-
 Maddox patrons patterns.png 231 × 680; 27 KB
-
 Map prevailing winds on earth.png 1,425 × 625; 157 KB
-
 Mass point affected by coriolis.svg 1,600 × 1,600; 3 KB
-
 NWS Upper air map 500mb 1998-01-05.gif 752 × 662; 315 KB
-
 Potential vorticity conservation.GIF 784 × 514; 12 KB
-
 PSM V16 D318 Maneuvering ships on the exterior of a cyclone.jpg 1,414 × 1,419; 183 KB
-
 PSM V16 D321 Chart of storm tracks of north pacific ocean.jpg 2,889 × 1,648; 676 KB
-
 PSM V16 D323 Cyclone crossing from north america to europe.jpg 1,639 × 1,276; 272 KB
-
 PSM V16 D329 Chart of equal barometric pressures in and around north america.jpg 1,642 × 1,418; 473 KB
-
 PSM V53 D324 General circulation of atmosphere.jpg 1,722 × 2,281; 509 KB
-
 PSM V76 D453 Funnel shaped vortex.png 1,616 × 976; 199 KB
-
 PSM V76 D454 Dumbbell shaped vortex.png 828 × 1,603; 178 KB
-
 PSM V76 D455 Truncated dumbbell shaped vortex.png 1,627 × 703; 89 KB
-
 PSM V76 D456 Half section of a hurricane vortex.png 1,616 × 209; 40 KB
-
 PSM V77 D455 Funnel shaped vortex.png 1,616 × 976; 199 KB
-
 PSM V77 D456 Dumbbell shaped vortex.png 828 × 1,603; 178 KB
-
 PSM V77 D457 Truncated dumbbell shaped vortex.png 1,627 × 703; 89 KB
-
 PSM V77 D458 Half section of a hurricane vortex.png 1,616 × 209; 40 KB
-
 Pyörrekovarianssi-tekniikan kaaviokuva es.png 600 × 292; 250 KB
-
 Pyörrekovarianssi-tekniikan kaaviokuva.jpg 600 × 292; 42 KB
-
 ShipTracks MODIS 2005may11.jpg 4,502 × 3,937; 4.58 MB
-
 Trajectoire dépressions continentales américaines.png 800 × 657; 843 KB
-
 Trough.jpg 400 × 300; 12 KB
-
 Trough.svg 512 × 384; 1 KB
-
 Wcdiagram.jpg 515 × 358; 48 KB
-
 Westerlies Illustration 1.png 498 × 315; 6 KB
-
 Westerlies Illustration 2.png 534 × 360; 6 KB
-
 Wetterlagen.jpg 933 × 1,208; 341 KB
-
 Zonal band.gif 485 × 485; 11 KB
-
 Zonal band.svg 717 × 721; 60 KB
-
 Zonalflow.gif 413 × 265; 13 KB
-
 Αφροδίτης κυκλοφορία.jpg 800 × 539; 216 KB
-
 トラフ.jpg 400 × 300; 15 KB
-
 大氣環流.png 300 × 264; 48 KB


.jpg)


