Category:Charts showing data through 2020
Jump to navigation
Jump to search
Deutsch: Statistiken bis zu und einschließlich 2020. Viele Grafiken fehlen hier noch – bitte hinzufügen.
English: Charts showing data up to and including 2020.
- Many charts are still missing – please help categorizing charts, e.g. from here. Outdated charts can often be updated. Only charts on notable subjects with specified data source(s) should be included.
| NO WIKIDATA ID FOUND! Search for Charts showing data through 2020 on Wikidata | |
| Upload media |
Subcategories
This category has the following 2 subcategories, out of 2 total.
W
Media in category "Charts showing data through 2020"
The following 40 files are in this category, out of 40 total.
-
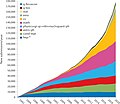
 Academic papers by discipline (visualization of 2012–2021 OpenAlex data; v2).png 1,293 × 840; 185 KB
-
 Acres-burned-per-wildfire-usa (OWID 0038).png 850 × 600; 52 KB
-
 Annual traffic deaths by age Netherlands 1950-2020.png 1,281 × 833; 82 KB
-
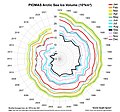 Arctic-death-spiral.jpg 1,024 × 960; 258 KB
-
 ArXiv's yearly submission rate plot.jpg 703 × 608; 71 KB
-
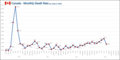 Canada - Monthly Death Rate (Jul 14, 2023).png 1,577 × 786; 101 KB
-
 Cardiovascular-disease-death-rate-over-time-males-vs-females.png 3,400 × 3,398; 896 KB
-

-
 Chart of publications in quantum physics on arXiv per month.webp 2,163 × 979; 85 KB
-
 Cited papers by field according to data in OpenAlex.png 1,174 × 1,376; 286 KB
-
 CO2 emissions Indonesia.svg 850 × 600; 37 KB
-
 CO2-by-source (OWID 0142).png 850 × 600; 58 KB
-
 Daily-caloric-supply-derived-from-carbohydrates-protein-and-fat.png 3,400 × 2,400; 468 KB
-
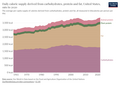
 Electricity production by source, Russia 1985-2020.jpg 1,280 × 903; 68 KB
-
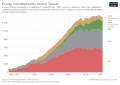 Energy consumption by source, Taiwan.svg 850 × 600; 43 KB
-
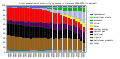 Energymix Germany.svg 810 × 400; 157 KB
-
 Featured picture nominations per month in Wikimedia Commons.svg 1,708 × 811; 101 KB
-
 Fertility rate by State.webp 1,377 × 754; 345 KB
-

-
 Global aging demographics.webp 1,946 × 894; 96 KB
-
 Global sea level rise from 1992 to 2020, satellite data chart.svg 800 × 540; 59 KB
-
 Global Temperature And Forces.svg 960 × 720; 24 KB
-
 Global-malaria-deaths-by-world-region.jpg 3,400 × 2,400; 107 KB
-

-
 Infectious-and-parasitic-diseases-death-rate-who-mdb.jpg 3,400 × 3,718; 833 KB
-
 LEO-SpaceDebris-Nov2020.png 800 × 550; 194 KB
-
 Life expectancy at birth by sex in US, 2000 to 2021.png 874 × 550; 61 KB
-
 Linux Distribution Timeline Dec. 2020.svg 3,020 × 12,114; 516 KB
-
 Literacy-rate-of-young-men-and-women-line.png 3,400 × 2,400; 375 KB
-
 Macroplastics-in-ocean (OWID 0563).png 850 × 600; 73 KB
-
 Mauna Loa Tetrafluoromethane.jpg 1,051 × 791; 259 KB
-
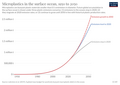 Microplastics-in-ocean (OWID 0661).png 850 × 600; 71 KB
-
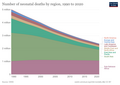 Number-of-neonatal-deaths-by-region.png 3,400 × 2,400; 452 KB
-
 Number-requiring-treatment-for-ntds-by-region.png 3,400 × 2,400; 415 KB
-
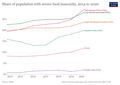 Prevalence-of-severe-food-insecurity-by-region.png 3,400 × 2,400; 388 KB
-
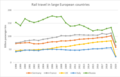 Rail transport in Europe 2020.png 930 × 593; 36 KB
-
 Scientific Studies by Field (visualization of 2012–2021 OpenAlex data).png 1,182 × 1,389; 288 KB
-
 Temperature reconstruction last two millennia cs.svg 485 × 325; 109 KB
-
 Temperature reconstruction last two millennia.svg 485 × 325; 134 KB
-
 Wikipedia editors by language over time.png 3,452 × 2,243; 563 KB
.png)
.png)


.png)

.png)


.png)


.png)

.png)


.png)


