Category:Epidemiology
Jump to navigation
Jump to search
English: Epidemiology
Italiano: L'epidemiologia (dal Greco επι= sul, δημος= popolo e λογος= discorso, studio) è la disciplina della medicina che si occupa dell'osservazione e dello studio della distribuzione delle malattie e di tutti gli eventi di rilevanza sanitaria sulla popolazione.
L'epidemiologia si serve della statistica, per gli strumenti matematici e della demografia.
È suddivista in tre branche:
- Epidemiologia descrittiva
- Epidemiologia analitica
- Epidemiologia sperimentale
study of the patterns, causes, and effects of health and disease conditions  | |||||
| Upload media | |||||
| Instance of | |||||
|---|---|---|---|---|---|
| Subclass of | |||||
| |||||
Subcategories
This category has the following 38 subcategories, out of 38 total.
*
B
C
D
- Disease ecology (7 F)
- Disease mapping (18 F)
- Disease susceptibility (7 F)
E
G
- Genetic epidemiology (2 F)
- Geriatric epidemiology (1 F)
H
M
P
R
S
- Social epidemiology (17 F)
- Spatial epidemiology (20 F)
T
V
- Vaccination statistics (67 F)
W
- Wastewater surveillance (7 F)
- Wikiversity/Räumliche Modellbildung (138 F)
Media in category "Epidemiology"
The following 155 files are in this category, out of 155 total.
-
 1952 Great London Smog mortality.png 2,585 × 3,498; 8.05 MB
-
 2007FootandMouthPath.JPG 2,848 × 2,136; 1.43 MB
-
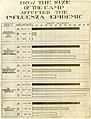 3300170164 04fa4488c3 oSizeCamp.jpg 781 × 1,024; 414 KB
-
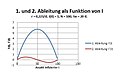 Ableitung-I.jpg 507 × 337; 22 KB
-
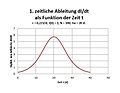 Ableitung-t.jpg 533 × 414; 26 KB
-
 Absolute changes by various pre-test probabilities.png 2,104 × 2,038; 259 KB
-
 Anzahl vergebener Zertifikate.jpg 700 × 379; 50 KB
-
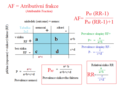 Atributivní frakce.png 603 × 451; 35 KB
-
 Back to sleep plot.png 1,500 × 1,125; 164 KB
-
 Bezinfekcnost.pdf 1,239 × 1,752; 49 KB
-
 Bill of Mortality.jpg 500 × 839; 359 KB
-
 Biraben-1650-as-published--.jpg 1,092 × 1,196; 303 KB
-
 Biraben-1650-as-published.jpg 1,125 × 1,330; 382 KB
-
 Biraben-1650-interpolated--.jpg 1,093 × 1,151; 293 KB
-
 Biraben-1650-interpolated.jpg 1,131 × 1,287; 541 KB
-
 BMI and RR of Mortality.png 2,440 × 1,788; 152 KB
-
 Broad Street graf.jpg 473 × 283; 12 KB
-
 Centres de surveillance épidémiologique.jpg 394 × 301; 52 KB
-
 CfMortalidadeInfantil.jpg 729 × 617; 79 KB
-
 Chí kvadrát tabulka.png 573 × 295; 15 KB
-
 CidreCyder-rebuttalSaturnisme.jpg 239 × 387; 32 KB
-
 Coes-microcefalias---informe-epidemiol--gico---se-47.jpg 690 × 511; 79 KB
-
 CompartmentalModel.jpg 970 × 644; 146 KB
-
 Correlation between BNP serum level and mortality.png 595 × 564; 54 KB
-
 Courbe épidémie par Propagation.jpg 415 × 242; 20 KB
-
 Courbe épidémique agrégation temporelle.jpg 415 × 609; 29 KB
-
 Courbe épidémique avec cas cumulés.jpg 415 × 250; 14 KB
-
 Courbe épidémique avec cases.jpg 336 × 205; 8 KB
-
 Courbe épidémique Source commune continue 2.jpg 415 × 250; 20 KB
-
 Courbe épidémique Source commune continue.jpg 415 × 250; 14 KB
-
 Courbe épidémique Source commune intermittente.jpg 415 × 250; 13 KB
-
 Courbe épidémique Source commune ponctuelle.jpg 415 × 250; 16 KB
-
 Courbe épidémique temps d'incubation.jpg 542 × 292; 22 KB
-
 Courbe épidémique Variation géo.jpg 641 × 443; 83 KB
-
 Daily addition of test results for COVID tests NYC.png 600 × 371; 20 KB
-
 Densitydependentdiseasegraph.png 317 × 214; 10 KB
-
 Difference between outbreak, endemic, epidemic and pandemic-ar.png 1,280 × 720; 67 KB
-
 Difference between outbreak, endemic, epidemic and pandemic-en.png 1,280 × 720; 68 KB
-
 Disease burden.png 1,085 × 831; 52 KB
-
 Domain Homology.png 929 × 435; 142 KB
-
-
 Dsadasa.png 720 × 540; 98 KB
-
 Egg, a type of "Conceptual-Particle".jpg 3,998 × 2,969; 4.76 MB
-
 ELISA gE.png 766 × 548; 66 KB
-
 Epidemeoloy.JPG 512 × 384; 9 KB
-
 Epidemibegränsning.png 784 × 400; 33 KB
-
 Epidemic curves.jpg 960 × 720; 143 KB
-
 Epidemie a endemie.png 487 × 315; 21 KB
-

-
 Epidemiologia mfreq pt02.png 557 × 487; 24 KB
-
 Epidemiologia mfreq pt04.png 557 × 487; 16 KB
-
 Epidemiology in Relation to Air Travel.jpg 256 × 414; 62 KB
-
 Equine-flu-alert-nsw.jpg 872 × 692; 101 KB
-
 Estrutura Epidemiologica.jpg 700 × 415; 43 KB
-
 Europa polioeradicatio.jpg 1,420 × 1,063; 392 KB
-
 Example data reduction diagram for health data analysis.jpg 433 × 519; 26 KB
-
 Example web of causation for PSA test.jpg 567 × 450; 39 KB
-
 ExplainingCaseControlSJW.jpg 948 × 1,415; 145 KB
-
 Fdsfdvds.png 720 × 540; 104 KB
-
 Ferguson influenza generation time distribution.png 550 × 450; 28 KB
-
 Figur 1 Epidemiologic studies populations.jpg 454 × 356; 38 KB
-
 Four children, two with measles, in the same bed; their moth Wellcome V0015129.jpg 3,050 × 2,359; 3.54 MB
-
 France-GBD-Compare.jpg 697 × 475; 49 KB
-
 Geogebra logistic growth epidemiology1.png 1,237 × 644; 89 KB
-
 GLP Bewegung Tag 0bis3.gif 1,200 × 900; 1.06 MB
-
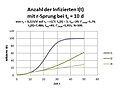
 GLP Infizierte Tag 1 28 56.gif 814 × 613; 19.54 MB
-
 Hald model parameters.png 1,425 × 911; 106 KB
-
 Herzinsuffizienz Inzidenz.jpg 2,958 × 2,391; 2.52 MB
-
 Hierarchie důkazů.png 487 × 360; 29 KB
-
 HighSensitivity LowSpecificity cs.png 1,401 × 1,050; 54 KB
-
 Historia-natural-da-doenca.jpg 3,543 × 1,897; 727 KB
-
 Historie kauzality 2.png 573 × 516; 47 KB
-
 IMCB photo.jpg 1,408 × 1,024; 238 KB
-
 Infografika - zápach z úst v ČR.png 700 × 3,883; 1.29 MB
-
 Instruments interviews SHIP.JPG 820 × 1,424; 184 KB
-
 Instruments SHIP 27.11.2010.JPG 820 × 926; 116 KB
-
 Inzidenz CLL.jpg 720 × 540; 28 KB
-
 IplusS-1.jpg 941 × 669; 93 KB
-
 IplusS.jpg 484 × 302; 20 KB
-
 Jaime Breilh Paz y Miño.jpg 3,888 × 2,592; 1.29 MB
-
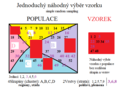 Jednoduchý náhodný výběr.png 541 × 399; 37 KB
-
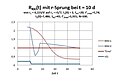
 KM r=1.0 g=0.5.gif 800 × 600; 481 KB
-
 KM1.3.gif 800 × 600; 514 KB
-
 Leavell & Clark infarto de miocardio.png 3,280 × 1,736; 425 KB
-

-
 LR nomogram.png 260 × 440; 3 KB
-
 MapofResistance.jpg 1,280 × 661; 77 KB
-
 Markrova vakcína.png 627 × 349; 22 KB
-
 Migration.png 664 × 294; 27 KB
-
 Missing not at random.png 855 × 555; 55 KB
-
 Modelo epidêmico SIR.jpg 1,710 × 266; 26 KB
-
 Mortalità per consumo di alcol.jpg 733 × 777; 53 KB
-
 MovingPopulation.jpg 1,200 × 798; 1.04 MB
-
 MRI Protocol.JPG 815 × 814; 164 KB
-
 N. Hodges, Loimologia, Or an historical acco Wellcome L0031721.jpg 1,500 × 1,556; 787 KB
-
 Neonatal Death.png 739 × 488; 16 KB
-
 Neuropathologen 1.PNG 400 × 258; 6 KB
-
 Neuropathologen 2.PNG 401 × 251; 6 KB
-
 Neuropathologen 3.PNG 401 × 243; 6 KB
-
 Neuropathologen 4.PNG 402 × 240; 6 KB
-
 Non-communicable disease risk factors graph.png 4,000 × 2,296; 426 KB
-
 Náhodný skupinový výběr.png 542 × 372; 31 KB
-
 OEK.JPG 2,038 × 1,525; 474 KB
-
 Pandemic.png 1,195 × 452; 221 KB
-
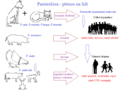 Pasterelóza lidí.png 703 × 526; 93 KB
-
 Point prevalence1.png 720 × 540; 54 KB
-
 Prognostická hodnota a Bayes theorem.png 401 × 502; 38 KB
-
 Průřezová studie matematicky.png 718 × 390; 54 KB
-
 Příčina a následek nemoci.png 394 × 299; 12 KB
-
 Questionnaires 27102010.JPG 821 × 1,207; 290 KB
-
 R-Sprung 1.jpg 526 × 411; 62 KB
-
 R-Sprung 2.jpg 523 × 405; 61 KB
-
 R-Sprung 3.jpg 550 × 371; 56 KB
-
 Radon Lognormal distribution.gif 1,280 × 822; 38 KB
-
 Rage renards empoisonnement vaccination 1988.jpg 795 × 569; 149 KB
-
 RCT.png 665 × 382; 34 KB
-
 Relative prevalence of familial hyperlipoproteinemias.png 1,117 × 683; 78 KB
-
 REP Logo 2016.png 600 × 887; 2.05 MB
-
 Rep-logo.gif 243 × 303; 23 KB
-
 Rep-logo.jpg 139 × 194; 55 KB
-
 RischioTumoriMondialeTable.png 600 × 216; 63 KB
-
 RischioTumoriRicchi.png 600 × 451; 79 KB
-
 RischioTumoriRicchiTable.png 600 × 216; 64 KB
-
 Screenshot of the Nextstrain homepage as of 2020-04-03.jpg 1,440 × 7,066; 2.11 MB
-
 SEIR.PNG 887 × 99; 4 KB
-
 SENSOR logo.jpg 150 × 112; 5 KB
-
 Simulation der Covid-19-Pandemie mit Python.png 1,280 × 960; 80 KB
-
 Simulation mit Distanz.gif 312 × 312; 3.98 MB
-
 Simulation.gif 312 × 312; 2.17 MB
-
 SIR NumericalExample.png 3,808 × 2,663; 694 KB
-
 Sir-model-wikiversity.png 560 × 420; 7 KB
-
 SIR.PNG 660 × 99; 3 KB
-
 SIRERICSCHUMACHER.gif 1,024 × 576; 7.64 MB
-
 SIS.PNG 414 × 88; 2 KB
-
 Smrtnost od VZN u Srbiji 2014..jpg 500 × 498; 64 KB
-
 Suicides by firearm 1999-2005.png 675 × 638; 54 KB
-
 Systematický náhodný výběr.png 542 × 399; 41 KB
-
 Síla a přesnost.png 452 × 508; 29 KB
-
 Taux de reproduction de base.jpg 737 × 220; 20 KB
-
 Temperature & mortality of London, 1840-50 Wellcome L0039176.jpg 4,660 × 3,787; 12.88 MB
-

-

-
 Titlepage of On Continous Molecular changes . . Wellcome L0005798.jpg 1,066 × 1,746; 524 KB
-
 TwoPopulations.png 397 × 684; 24 KB
-
 Virus spread pedestrian.gif 400 × 300; 700 KB
-
 Vrstevnatý náhodný výběr.png 542 × 399; 31 KB
-
 Vrstevnatý skupinový výběr.png 542 × 399; 38 KB
-
 Webp.net-gifmakerCovid.gif 640 × 360; 2.81 MB
-
 Wiki figure 1.png 468 × 540; 44 KB
-
 Wiki figure 2.png 457 × 332; 70 KB
-
 Wiki figure 3.png 816 × 428; 45 KB
-
 Étapes de la surveillance épidémiologique.jpg 816 × 720; 104 KB
-
 Éternuement coudes.jpg 1,317 × 787; 322 KB
-
 Índice de las enfermedades contagiosas.png 560 × 557; 40 KB
-
 כדשדר33.png 720 × 540; 87 KB


_(14782721372).jpg)


.svg)


