Category:Flow charts
Jump to navigation
Jump to search
- (en) Flowchart
- (ar) خرائط سير المعلومات
- (cs) Vývojový diagram
- (de) Programmablaufplan
- (el) Διάγραμμα ροής
- (eo) Fludiagramo
- (es) Diagrama de flujo
- (fr) Organigramme de programmation
- (he) תרשים זרימה
- (is) Flæðirit
- (it) Diagramma a blocchi
- (ja) フローチャート
- (ka) ბლოკ-სქემა
- (nl) Stroomdiagram
- (pl) Schemat blokowy
- (pt) Fluxograma
- (ru) Блок-схема
- (sl) Diagram poteka
- (sv) Flödesschema
- (uk) Блок-схема
- (zh) 流程图
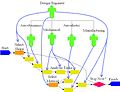
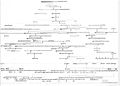
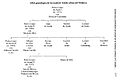
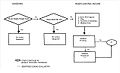
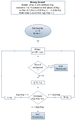
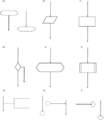
English: A Flowchart is a schematic representation of an algorithm or a process, or the step-by-step solution of a problem, using suitably annotated geometric figures connected by flowlines for the purpose of designing or documenting a process or program.
| Upload media | |||||
| Subclass of | |||||
|---|---|---|---|---|---|
| Said to be the same as | flowchart, flow diagram | ||||
| |||||
Diagrams that are not about control flow might better be categorized in one of the following categories instead: — Category:Data flow diagrams — Category:Life cycle diagrams — Category:Structure diagrams — Category:Workflow diagrams —
Subcategories
This category has the following 14 subcategories, out of 14 total.
B
- Biology flow charts (18 F)
C
- Call graph (5 F)
E
- Algorithm flowcharts elements (50 F)
I
- FC Icons (55 F)
M
- Mindomo (1 F)
P
S
- Swimlane diagrams (12 F)
- Systems flowcharts (25 F)
W
Media in category "Flow charts"
The following 200 files are in this category, out of 1,392 total.
(previous page) (next page)-
 "Critical Pathway Model".png 1,086 × 361; 122 KB
-
 '출처 부족' 문서 관리 Flow char.png 750 × 530; 33 KB
-
 01. Average of 5 Numbers (using For loop) - Start.svg 1,325 × 2,275; 7 KB
-
 02-Sandvig-Seeing-the-Sort-2014-WEB.png 640 × 1,093; 122 KB
-
 02. Average of 5 Numbers (using while loop) - Start.svg 1,325 × 2,575; 8 KB
-
 04 flow chart.jpg 1,856 × 1,920; 1.11 MB
-
 0701t.1.gif 436 × 64; 3 KB
-
 080721 BFM FlowChart02cc.jpg 355 × 600; 49 KB
-
 090427 Fiction Flowchart.jpg 2,480 × 3,508; 926 KB
-
 1.yol.JPG 591 × 509; 23 KB
-
 10thPlanetFlowChart.jpg 1,414 × 2,000; 998 KB
-
 111-SC-1020 - Medical Department - Medical restoration chart - NARA - 55163365.jpg 9,182 × 6,304; 17.33 MB
-
 12 Схема подання побутових та промислових стічних вод after 2.jpg 640 × 480; 45 KB
-
 1536266509 litochuslenna.png 1,403 × 668; 162 KB
-
 2 salt generator.png 483 × 294; 16 KB
-

-
 20210618 092431 22 Cheppel.jpg 2,048 × 1,365; 852 KB
-
 2PP counting flowchart.PNG 401 × 375; 12 KB
-
 3 3 260х70 5 Схема домогосподарств Сергіївки1946.jpg 30,709 × 8,268; 8.17 MB
-
 5 345х60якість6 7 3 СХЕМА28 10 2023 домогосподарств в Сергіївці1946.jpg 40,748 × 7,087; 11.75 MB
-
 534pxСхема Солнцевской линии.jpg 532 × 300; 48 KB
-
 A flow chart of London museums by Matt Brown.jpg 9,076 × 6,940; 5.81 MB
-
 A Flowchart for New Pages Patrol.png 1,050 × 1,601; 129 KB
-
 A* in DRAKON.png 1,890 × 860; 178 KB
-
 Aaaz.jpg 3,876 × 6,546; 1.03 MB
-
 Abbildung ISO.jpg 310 × 477; 28 KB
-
 ABC Pointer 1840.png 512 × 432; 98 KB
-
 ABCscheme.png 1,010 × 516; 20 KB
-
 AbsDelta.jpg 638 × 393; 37 KB
-
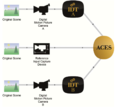 ACES Input Device Transform (IDT).png 1,023 × 908; 289 KB
-
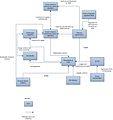
 ACES Output Device Transform (ODT) Workflow.png 1,639 × 889; 379 KB
-
 Actividades de la Ingeniería de Requisitos.png 1,018 × 442; 62 KB
-
 Activity Process model Regatta Adoption method.png 930 × 747; 69 KB
-
 Activity-diagram-small.png 450 × 854; 24 KB
-
 Actoranalysis.jpg 774 × 821; 47 KB
-
 Ad Hoc Flow.PNG 1,011 × 634; 77 KB
-
 Adamssv.jpg 720 × 540; 48 KB
-
 ADM-401.jpg 480 × 368; 56 KB
-
 Administracion de proyectos de sw.jpg 8,514 × 2,319; 1,005 KB
-
 Advanced Player Architecture.jpg 731 × 344; 27 KB
-
 AdvanceStep JavaScript function.png 2,720 × 1,760; 325 KB
-
 Agent-based-simulation-of-design-team.jpg 888 × 683; 77 KB
-
 Aideaudiagnostic.jpg 976 × 1,012; 91 KB
-
 AjaxMassDelete FlowChart.png 1,000 × 1,505; 122 KB
-
 Aji Pangeran Kusumanegara (Aji Darma).jpg 6,923 × 4,979; 7.97 MB
-
 Alampatttu flowchart.png 425 × 616; 17 KB
-
 Aldrich Ames.jpg 1,280 × 720; 44 KB
-
 Alec White Day 13.05.1999.jpg 1,744 × 848; 85 KB
-
 ALECSAT Protocol.png 796 × 866; 77 KB
-
 Algorithm Ideal lattice.png 519 × 946; 107 KB
-
 Algorithms for the treatment of inguinal hernia.jpg 783 × 962; 95 KB
-
 Algoritmo ejm teclado.png 877 × 441; 18 KB
-
 Algoritmo Terapia Antibiotica con PCT.jpg 1,502 × 580; 104 KB
-

-

-
 AlgoritmoRaiz.png 308 × 441; 5 KB
-
 ALM Flowchart.pdf 1,275 × 1,650; 46 KB
-

-
 Alternative.png 211 × 166; 2 KB
-
 Ambchacor.png 610 × 238; 12 KB
-
 Anthill.png 732 × 419; 81 KB
-
 Anti-Semitic-Flowchart.png 550 × 1,578; 359 KB
-
 Antropologia Unidad II.jpg 7,405 × 3,438; 1.67 MB
-
 Anything in anything diagram.png 708 × 55; 1 KB
-
 Application for TAN.jpg 1,212 × 1,084; 360 KB
-
 ARBOL DESICION.jpg 602 × 743; 104 KB
-
 Arbol genealógico de los Ayala en Toledo.JPG 794 × 537; 49 KB
-
 Archival flowchart for User talk.png 1,416 × 608; 40 KB
-
 Arduino-based wow-and-flutter meter DSP arrangement.png 2,205 × 2,493; 122 KB
-
 Armadio-Wardrobe.svg 673 × 886; 171 KB
-
 Armadio.svg 673 × 886; 169 KB
-
 Armazenamento.jpg 673 × 685; 34 KB
-
 Army Weight Control screening flowchart.jpg 630 × 385; 42 KB
-
 Arnold model.png 824 × 196; 66 KB
-
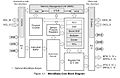 Arquitectura MicroBlaze.jpg 670 × 436; 82 KB
-
 ArquiteturaDC.png 1,082 × 637; 79 KB
-
 Assessment and treatment algorithm for overweight and obesity.png 682 × 525; 55 KB
-
 Assume Good Faith Flowchart.png 222 × 462; 23 KB
-
 ATKMB flowchart.png 703 × 437; 34 KB
-
 Audio deepfake detection.png 7,297 × 2,062; 1.51 MB
-
 Australian Government Structure.png 778 × 801; 88 KB
-
 Australian Government Structure.svg 795 × 800; 85 KB
-

-
 Autoencoder schema uk.png 841 × 765; 32 KB
-
 AV History.jpg 1,280 × 1,024; 72 KB
-
 Babble робота.jpg 3,424 × 2,452; 481 KB
-
 Bahai-administrationen med Kluster.jpg 510 × 866; 121 KB
-
 Base1flowchart.jpg 828 × 520; 99 KB
-
 Basic conceptual data model for the FuReSH tool registry.png 784 × 689; 83 KB
-
 Basic git branching workflow (GitLab).png 1,473 × 540; 60 KB
-
 Basic git branching workflow (GitLab).svg 962 × 338; 11 KB
-
 BdokTseva.jpg 830 × 421; 61 KB
-
 Beer Distribution Game Board.JPG 1,424 × 318; 62 KB
-
 Beggar-My-Neighbour.png 369 × 1,178; 7 KB
-
 Bellman flow chart.png 1,221 × 541; 42 KB
-
 Berlekamp–Massey algorithm.png 461 × 585; 11 KB
-
 BerlinerModellEN.jpg 794 × 1,123; 129 KB
-
 BFSB.png 1,014 × 1,055; 28 KB
-
 BIAPlusFig.png 724 × 587; 91 KB
-
 Bichova promivna mashina.gif 395 × 462; 22 KB
-
 Big picture high res version.jpg 625 × 410; 62 KB
-
 BigBluDpim.png 1,983 × 857; 440 KB
-
 Bill process Australia.png 1,378 × 2,867; 46 KB
-
 Binary tree sort(2).png 584 × 894; 42 KB
-
 BinarySearch.Flowchart.png 459 × 722; 22 KB
-
 Biological effects LLLT.jpg 4,984 × 3,673; 2.07 MB
-
 Block diagram flowchart.png 440 × 498; 17 KB
-
 Block diagram PALS1.png 339 × 373; 13 KB
-
 Block diagram PALS2.jpg 497 × 374; 16 KB
-
 Block diagram PALS3.jpg 489 × 674; 45 KB
-
 Block diagram PALS4.jpg 746 × 404; 26 KB
-
 BlockDiagramLineFollower.jpg 1,200 × 120; 24 KB
-
 Bobruisk Trolleybus.png 1,856 × 2,724; 339 KB
-
 Bodoke1.jpg 510 × 373; 33 KB
-
 Body of the deceased.png 1,040 × 720; 10 KB
-
 Bogosort.png 567 × 351; 15 KB
-
 Bomay.png 600 × 328; 40 KB
-
 Bondarenko 02.02.21.jpg 1,864 × 1,608; 216 KB
-
 BORO process Flowchart.png 1,253 × 1,344; 52 KB
-
 Bouc émissaire - Réaction en chaîne.jpg 664 × 600; 49 KB
-
 Branching in DRAKON.png 310 × 410; 16 KB
-
 Brandanschläge-Fahrzeuge-Verhältnis.jpg 544 × 129; 32 KB
-
 Brent flowchart.jpg 1,682 × 3,707; 550 KB
-
 Brent flowchart.png 842 × 1,854; 97 KB
-
 Bucles.png 1,366 × 1,000; 18 KB
-
 BuildBM5.jpg 829 × 451; 75 KB
-
 Busca binaria.png 547 × 537; 35 KB
-
 Busca sequencial.png 416 × 355; 18 KB
-
 C4D-infoVScomm.pdf 1,752 × 1,239; 504 KB
-
 C4D-intra intercom.pdf 1,752 × 1,239; 549 KB
-
 C4D-Rome Consensus.pdf 7,014 × 4,960; 445 KB
-
 C4D-telenovelas.pdf 4,960 × 3,506; 561 KB
-
 CA Course Flowchart.png 646 × 693; 115 KB
-
 Calculation.png 900 × 635; 99 KB
-
 Call by value and call by reference.png 346 × 255; 11 KB
-
 Capa de datos.png 1,253 × 838; 247 KB
-
 Captura diana.jpg 804 × 583; 107 KB
-
-
 Cartouche Bi.jpg 631 × 384; 34 KB
-
 Cat baykal.png 400 × 249; 5 KB
-
 Catch-22 flowchart.png 945 × 562; 59 KB
-
 Catch-22 flowchart.svg 945 × 562; 2 KB
-
 Catch22.png 657 × 807; 17 KB
-
 CBC mode of operation.png 601 × 242; 8 KB
-
 CCC Flowchart 2.jpg 394 × 1,092; 81 KB
-
 CCC Flowchart 4.jpg 394 × 903; 85 KB
-
 CCC Flowchart 5.jpg 377 × 530; 59 KB
-
 CCC Flowchart 5d.jpg 363 × 503; 59 KB
-
 CCC Flowchart 5e.jpg 363 × 367; 51 KB
-
 CCC Flowchart 5f.jpg 363 × 432; 57 KB
-
 CCC Flowchart 5g.jpg 363 × 599; 63 KB
-
 CCC Flowchart 5h.jpg 363 × 583; 56 KB
-
 CCC Flowchart samples 3-19-08.jpg 808 × 658; 111 KB
-
 CCC Flowchart samples.jpg 1,247 × 1,805; 262 KB
-
 CDDiagram.png 125 × 125; 2 KB
-
 CE 208611 schemas.png 1,006 × 627; 48 KB
-
 Ceramic Water Filter Manufacturing Flowchart.svg 800 × 500; 192 KB
-
 CESAR GUERRERO TORRES.JPG 681 × 934; 91 KB
-
 Cfg.png 371 × 478; 12 KB
-
 Chain of responsibility UML diagram.png 527 × 291; 8 KB
-
 Chuguenkoalina.jpg 2,746 × 732; 116 KB
-
 Ciclo do programa.png 772 × 516; 170 KB
-
 Clase estructura del método Gray Watch.png 400 × 208; 24 KB
-
 CLIA Decision Algorithm for Laboratory Citations.png 609 × 784; 254 KB
-
 CMP-sitePlan.pdf 7,014 × 4,960; 3.32 MB
-
 CMSA-CD.png 422 × 674; 24 KB
-
 Co cau to chuc.png 743 × 425; 10 KB
-
 Codasyl.png 800 × 600; 90 KB
-
 Codasyl1.jpg 400 × 300; 71 KB
-
 Coffee production.png 90 × 400; 30 KB
-
 ColorWinMain1.jpg 870 × 520; 110 KB
-
 Comic series of Nagraj explained.jpg 1,123 × 669; 107 KB
-
 Comlinks.png 600 × 400; 403 KB
-
-
 Comp fetch execute cycle uk.svg 268 × 478; 78 KB
-
 Comp fetch execute cycle.png 990 × 2,215; 222 KB
-
-
 Competence ontwikkeling.jpg 1,211 × 275; 39 KB
-
 Comprehensible input hypothesis.png 425 × 218; 14 KB
-
 Computer-science-stub-zaw-3.png 40 × 35; 1 KB
-
 Computer-security-incident-initial-process.png 379 × 830; 15 KB
-
 Condicional.png 251 × 299; 2 KB
-
 Conocimientoinp.jpg 825 × 479; 68 KB
-
 Consumentenprijsschema.png 679 × 734; 40 KB
-
 Contenuti Tecnologia copia.jpg 3,295 × 2,291; 974 KB
-
 Contribution campaign flow chart.png 536 × 403; 95 KB
-
 Copia de flowchart shell.drawio.png 964 × 1,470; 182 KB
-
 CountObjectGraphesEtats.PNG 1,088 × 879; 31 KB
-
 CPR Flow.jpg 586 × 1,470; 368 KB
-
 Critical Pathway Model.jpg 1,280 × 720; 40 KB
-
 Croquisplanestrategico.jpg 917 × 706; 106 KB
-
 Crossminton playgrounds.jpg 896 × 191; 30 KB
-
 Crystal 128 kivio.png 128 × 128; 15 KB
-
 Crystal Clear app kivio.png 128 × 128; 15 KB
-
 CSB.png 1,210 × 1,464; 48 KB
-
 CSMA CA Flowchart.png 930 × 851; 20 KB
-
 CSMA-CDx.gif 443 × 696; 11 KB
-
 CSMA.jpg 660 × 367; 26 KB
-
 Csmaca algorithm.png 769 × 749; 29 KB
-
 Cucina-Kitchen.svg 1,051 × 744; 103 KB

_-_Start.svg)

_-_Start.svg)


.jpg)


.png)


.jpg)


_impact_of_low-_(upper_panel)_and_high-_(middle_panel)_agency_interventions_to_modify_levels_of_physical_activity.jpg)


.png)
_Workflow.png)
.png)
.svg)