Category:Function plots
Jump to navigation
Jump to search
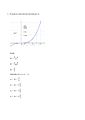
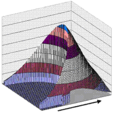
Representation of a function as the set of pairs (x, f(x))  Graph of the function f(x, y) = sin(x²) · cos(y²). | |||||
| Upload media | |||||
| Subclass of | |||||
|---|---|---|---|---|---|
| Facet of | |||||
| Different from | |||||
| |||||
Subcategories
This category has the following 4 subcategories, out of 4 total.
C
- Comparing function plots (51 F)
F
S
- Function plots on stamps (4 F)
V
- Valid SVG created with mplwp code (407 F)
Media in category "Function plots"
The following 200 files are in this category, out of 284 total.
(previous page) (next page)-
 01 Definition Lineare-Funktion Beispiel.png 1,372 × 950; 69 KB
-
 02 Lineare-Funktionen Definition Uebung-Zuordnung-zusammen.png 1,264 × 1,370; 183 KB
-
 03 Methode-Steigung-auslesen.gif 1,000 × 1,000; 176 KB
-
 03 Methode-Steigung-einzeichnen.gif 1,000 × 1,000; 178 KB
-
 1 area bajo la curva.jpg 1,240 × 1,754; 786 KB
-
 1 over x squared integral.svg 420 × 414; 51 KB
-
 1-x.png 360 × 217; 8 KB
-
 1.Näherung.svg 9,866 × 7,519; 60 KB
-
 12grafiks.png 347 × 401; 7 KB
-
 13grafiks.png 348 × 398; 7 KB
-
 1N3E SVG.svg 727 × 103; 14 KB
-
 1overx.svg 325 × 230; 41 KB
-
 1x(1-x).png 360 × 213; 10 KB
-
 2 area bajo la curva.jpg 1,240 × 1,754; 69 KB
-
 20221121 19 22 17-File 20221121 19 09 30-Diagramm unter Windows Rechner.png 7,680 × 4,079; 2.57 MB
-
 20x^3(1-x).png 360 × 218; 9 KB
-
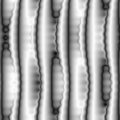 2D function cables.png 512 × 512; 120 KB
-
 2D function hourglass.png 512 × 512; 94 KB
-
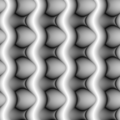
 2D function pills.png 512 × 512; 128 KB
-
 2D function snake.png 512 × 512; 42 KB
-
 2D function swirl.png 512 × 512; 275 KB
-
 2D function yin yang.png 512 × 512; 131 KB
-
 2D line plot using PLplot library.png 842 × 595; 32 KB
-
 2d-epochs-overfitting.svg 900 × 739; 86 KB
-
 2x^2-2 und 2x+2 Graphen.png 333 × 333; 2 KB
-
 2ábra.png 960 × 720; 21 KB
-
 3.a.ábra.png 960 × 720; 21 KB
-
 30 слова.png 800 × 800; 245 KB
-
 3n=2.png 599 × 385; 13 KB
-
 3n=3.png 597 × 377; 13 KB
-
 3n=4.png 594 × 364; 13 KB
-
 3ofN Samples.JPG 540 × 423; 39 KB
-
 3ptsyeqxpl2.png 1,659 × 1,291; 45 KB
-
 3rett.png 415 × 414; 13 KB
-
 5.3 p1.PNG 642 × 196; 9 KB
-
 6.1n=6-1.PNG 606 × 410; 21 KB
-
 90 Kapiteltest Lineare-Funktionen A1.png 3,000 × 2,936; 325 KB
-
 90 Kapiteltest Lineare-Funktionen A2-Loesung.png 3,000 × 2,936; 272 KB
-
 Absolute Value Equation Graphed.svg 512 × 424; 18 KB
-
-
 Abtastfleck Glocke.png 244 × 260; 18 KB
-
 Activation softsign.png 120 × 60; 1 KB
-
 Afgeleide1.png 794 × 1,123; 51 KB
-
 After contraction.gif 936 × 778; 13 KB
-
 Anthos.png 642 × 702; 614 KB
-
 Apparent magnitude.svg 914 × 598; 72 KB
-
 Apshoot.jpg 732 × 542; 38 KB
-
 Arbitrary function graph.png 1,246 × 942; 72 KB
-
 Arcosh(sec x).png 500 × 500; 11 KB
-
 Arcoth(csc x).png 500 × 500; 14 KB
-
 Arcsch(cot x).png 500 × 500; 15 KB
-
 Arcsec(cosh x).png 500 × 500; 9 KB
-
 Arcsin(tanh x).png 500 × 500; 9 KB
-
 Arctan(sinh x).png 500 × 500; 9 KB
-
 Artanh(sin x).png 500 × 500; 14 KB
-
 Askelvaste.svg 609 × 458; 22 KB
-
 Atan-x.png 1,424 × 852; 49 KB
-
 AV123 csd그래프.jpg 575 × 431; 54 KB
-
 Bernoulli distribution chart.jpg 688 × 431; 48 KB
-
 Bernstein Polynomials.svg 396 × 390; 41 KB
-
 BESK computer plot.jpg 286 × 318; 23 KB
-
 Blancmange.svg 600 × 400; 103 KB
-
 Brillouin Function.svg 737 × 506; 112 KB
-
 Brjuno function.png 1,000 × 1,000; 26 KB
-
 Buckling curvature 2.gif 550 × 169; 217 KB
-
 Bullet-nose-curves.jpg 474 × 278; 15 KB
-
 Bumbra.png 388 × 369; 7 KB
-
 Bump function.png 2,400 × 1,600; 149 KB
-
 Bus DAV-gebied lijnen.png 2,079 × 1,040; 95 KB
-
 Butterworth filter wp.svg 607 × 488; 61 KB
-
 CatalysisScheme-en.svg 801 × 418; 1 KB
-
 CatalysisScheme-ru.svg 801 × 418; 1 KB
-
 CatalysisScheme.png 1,159 × 681; 35 KB
-
 Cine15.jpg 250 × 202; 7 KB
-
 Cipcal.jpg 842 × 595; 48 KB
-
 Combined functions.jpg 605 × 340; 17 KB
-
 ConcaveDef.png 427 × 295; 8 KB
-
 Concavidad.gif 250 × 221; 6 KB
-
 Contre exemple Rolle.svg 470 × 350; 9 KB
-
 Convfunc1.PNG 597 × 508; 12 KB
-
 Corriente Carga I(R).jpg 1,303 × 415; 188 KB
-
 Corriente I(R).jpg 1,303 × 383; 181 KB
-
 Courbe 1.jpg 768 × 460; 43 KB
-
 Courbe-en-S.svg 456 × 321; 9 KB
-
 Crosshatch 3D plot showing nodes.PNG 850 × 670; 58 KB
-
 Crosshatch 3D plot with projected level curves.PNG 850 × 670; 59 KB
-
 CubicEquation 1.png 481 × 405; 6 KB
-
 CubicEquation 2.png 517 × 345; 6 KB
-
 Curl of nonuniform curl.JPG 181 × 238; 14 KB
-
 Curl of uniform curl.JPG 183 × 231; 15 KB
-
 Càlcul del pendent d'una recta.PNG 568 × 231; 7 KB
-
 Cálculo gráfico.JPG 199 × 240; 9 KB
-
 D 6 invariant cubic.png 756 × 756; 28 KB
-
 DC Graph.jpg 3,264 × 2,448; 1.79 MB
-
 Definicó de pendent.PNG 437 × 191; 5 KB
-
 Distribucion ameni.JPG 740 × 395; 17 KB
-
 Distribucion amenidad2.JPG 742 × 445; 22 KB
-
 Distribucion firma ameni.JPG 745 × 452; 23 KB
-
 Double factorial.PNG 407 × 267; 15 KB
-
 EB1911 Probability - curve.jpg 256 × 243; 7 KB
-
 EB1911 Probability - skew curve.jpg 375 × 240; 13 KB
-
 Egm6341.s11.team3.HW5.3.png 571 × 416; 9 KB
-
 Elementar funksiyalar.jpg 712 × 358; 9 KB
-
 Endmatrix Rand 1.gif 1,200 × 900; 1.46 MB
-
 Endmatrix Rand.gif 1,200 × 900; 1.46 MB
-
 Engagement redes sociales ballesteros2019.jpg 508 × 362; 35 KB
-
 Equation123.jpg 914 × 523; 22 KB
-
 Equation12345.jpg 896 × 533; 24 KB
-
 Equationnnn.jpg 897 × 512; 17 KB
-
 Equilibrio amenidades.JPG 469 × 480; 16 KB
-
 Erster Modellierungszyklus.gif 1,024 × 768; 511 KB
-
 Esimerkki1.3.svg 304 × 306; 43 KB
-
 EsimerkkiA1.svg 317 × 301; 51 KB
-
 EsimerkkiA2.svg 311 × 301; 44 KB
-
 Evolvente.png 683 × 586; 24 KB
-
 Example TUFs.png 398 × 296; 11 KB
-
 Exp train.gif 800 × 300; 9 KB
-
 Exponential function parameter B.svg 313 × 326; 98 KB
-
 Extrema example de2.svg 510 × 380; 4 KB
-
 F(x,y)=−((cosx)^2 + (cosy)^2)^2.PNG 1,000 × 705; 68 KB
-
 F01 r phi circles colored RK.png 624 × 620; 218 KB
-
 F02 r phi rays colored RK.png 624 × 620; 203 KB
-
 F03 r phi circles+rays colored RK.png 624 × 620; 280 KB
-
 FEATeam5HW7p1.png 560 × 420; 12 KB
-
 Fifty-one-graph.jpg 483 × 291; 25 KB
-
 Figgg.jpg 442 × 286; 19 KB
-
 FinitePolytropes.svg 533 × 533; 14 KB
-
 FMIB 49323 Serial sounding, Station 64`.jpeg 342 × 1,569; 122 KB
-
 FMIB 49324 Serial sounding, Station 87.jpeg 324 × 1,551; 118 KB
-
-

-

-

-
-

-
 Folge.gif 365 × 405; 23 KB
-
 Fractional diff.gif 640 × 480; 8.82 MB
-
 Function x for x smaller 0.5 and 1-x for x bigger 0.5.svg 600 × 480; 22 KB
-
 Function x for x smaller 1 and 0 for x equal 1.svg 600 × 480; 20 KB
-
 Function x^2-2x-3 with derivate and tangent.svg 600 × 480; 21 KB
-
 FunctionInverse00.svg 379 × 376; 36 KB
-
 FunctionInverse01.svg 340 × 290; 71 KB
-
 FunctionInverse02.svg 379 × 376; 49 KB
-
 FunkAllg.png 684 × 383; 15 KB
-
 Funktion 1 durch x.svg 600 × 480; 9 KB
-
 FunktionenAllgemein3.svg 538 × 326; 89 KB
-
 FunktionenSchnittpunkteTheorie.png 900 × 1,068; 160 KB
-
 Funktionsgraph Q(z) (0-9).svg 239 × 238; 39 KB
-
 Funktionsgraph z(Q) (0-9).svg 239 × 244; 33 KB
-
 Geogebra f(x)=1÷sin(x) 20211118.svg 1,096 × 699; 107 KB
-
 Geogebra f(x)=1÷x 20211118.svg 1,096 × 699; 114 KB
-
 Geogebra f(x)=1÷x³ 20211118.svg 1,096 × 699; 109 KB
-
 Geogebra f(x)=ceil(x) 20211118.svg 1,096 × 699; 40 KB
-
 Geogebra f(x)=floor(x) 20211118.svg 1,096 × 699; 40 KB
-
-
 Geometric mean of 3 consecutive integers absolute values.png 800 × 600; 17 KB
-

-
 Geometric mean of 3 consecutive integers real input real output.png 800 × 600; 18 KB
-
 Grafico tendente para infinito positivo.png 446 × 224; 3 KB
-
 Grafik Barisan Recaman - Recamán Sequence Plot.png 945 × 744; 45 KB
-
 Graph of tschirnhausen cubic.svg 451 × 318; 35 KB
-
 Graphe de x^^x.png 993 × 976; 67 KB
-
 Graphs of f1(x)=x÷(x+1) and f2(x)=1÷(x+1).svg 488 × 394; 59 KB
-

-
 Graphtable.JPG 414 × 240; 16 KB
-
 Growth equations.png 1,248 × 1,248; 31 KB
-
 Gràfica del arcsinus.png 360 × 360; 11 KB
-
 Gráfico de dos funciones 01.jpg 1,080 × 1,515; 159 KB
-
 Hazkundearen mugak.svg 744 × 1,052; 147 KB
-
 Height function.jpg 474 × 283; 9 KB
-
 Hiperbola z funkcji cosh(t) i sinh(t).png 288 × 287; 3 KB
-
 HorizontalLine.svg 800 × 532; 12 KB
-
 HornerandNewton.gif 500 × 350; 851 KB
-
 Ibilbidea.png 734 × 455; 36 KB
-
 Indice d'Atkinson.svg 744 × 1,053; 126 KB
-
 Infimal convolution of a cone with a cubic curve.svg 600 × 400; 1.96 MB
-
 Int si(x).PNG 402 × 252; 5 KB
-
 Invariant quartic.png 756 × 756; 36 KB
-
 Inverse Tangent Integral.svg 473 × 285; 31 KB
-
 InverseTangentIntegral.svg 576 × 432; 17 KB
-
 J-Li 2.png 1,893 × 1,171; 42 KB
-
 J-Li.png 1,893 × 1,171; 41 KB
-
 Kampyle of Eudoxus.svg 451 × 318; 36 KB
-
 Kleine Matrix Rand 1.gif 1,200 × 900; 1.46 MB
-
 Kleine Matrix Rand.gif 1,200 × 900; 1.46 MB
-
 Komplpavirsiauskirtimas8.png 800 × 600; 6 KB
-
 Kvadrat funksiya grafigi.jpg 300 × 300; 22 KB
-
 Lecture graphique d'images et d'antécédents 1.PNG 369 × 280; 143 KB
-
 Lim f cuando x tiende a infinito.gif 488 × 423; 98 KB
-
 Lim of 1 over x graph.png 669 × 667; 13 KB
-
 LIMITE infinito.gif 486 × 418; 61 KB
-
 Limits-to-growth-figure-35.svg 329 × 335; 23 KB
-
 Log-log plot example.svg 360 × 360; 6 KB
-
 Log-vs-linear.png 641 × 400; 10 KB
-
 LogLogPlot of Line.GIF 485 × 392; 8 KB
-
 Límite de una función f.gif 486 × 418; 104 KB
-
 Límite infinito - definición R,M.gif 488 × 423; 117 KB
-
 Maple display three curves.JPG 470 × 450; 22 KB
-
 Maple11.png 400 × 400; 81 KB
-
 Matrix Rand 1.gif 1,200 × 900; 1.46 MB


.png)


.png)


.png)
.png)
.png)
.png)
.png)
.png)
.png)


%3D%E2%88%92((cosx)%5E2_%2B_(cosy)%5E2)%5E2.PNG)


_(0-9).svg)
_(0-9).svg)
%3D1%C3%B7sin(x)_20211118.svg)
%3D1%C3%B7x_20211118.svg)
%3D1%C3%B7x%C2%B3_20211118.svg)
%3Dceil(x)_20211118.svg)
%3Dfloor(x)_20211118.svg)


%3Dx%C3%B7(x%2B1)_and_f2(x)%3D1%C3%B7(x%2B1).svg)


_i_sinh(t).png)


.PNG)


.jpg)
.jpg)