Category:Charts
Jump to navigation
Jump to search
graphical representation of data | |||||
| Upload media | |||||
| Subclass of | |||||
|---|---|---|---|---|---|
| Different from | |||||
| |||||
English: A chart is a graphical representation of data, in which "the data is represented by symbols, such as bars in a bar chart, lines in a line chart, or slices in a pie chart". A chart can represent tabular numeric data, functions or some kinds of qualitative structure and provides different info. The term "chart" as a graphical representation of data has multiple meanings:
- A data chart organizes and represents a set of numerical data.
- Maps that are adorned with extra information (map surround) for a specific purpose are often known as charts, such as a nautical chart or aeronautical chart, typically spread over several map sheets.
- Other domain specific constructs are sometimes called charts, such as the chord chart in music notation or a record chart for album popularity.

Subcategories
This category has the following 32 subcategories, out of 32 total.
*
- Animations of charts (1 F)
A
- Annotated charts (3 F)
C
- Charts of road signs (147 F)
- Climate charts (9 F)
D
E
G
L
N
P
R
S
- Shmoo Plot (3 F)
- Charts on stamps (5 F)
U
W
- Wikimedia Deutschland charts (118 F)
Media in category "Charts"
The following 200 files are in this category, out of 988 total.
(previous page) (next page)-
 "Social Media Timeline".webp 1,024 × 576; 45 KB
-
 (1335-1395) تغییرات جمعیت شهر کیان.jpg 2,701 × 2,003; 343 KB
-

-
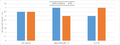
 (PNG Image, 2404 × 890 pixels) - Scaled (48%).png 2,404 × 890; 91 KB
-
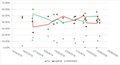
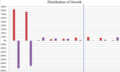 (Rough) Distribution of growth in the US 1917-2010.png 905 × 545; 49 KB
-
 03 June 1998 00z IAD Skew-T.jpg 640 × 350; 53 KB
-
 10nm Node Patterning Cost Comparison.png 713 × 267; 10 KB
-
 1517 or 1518 nautical chart, attributed to Pedro Reinel.jpg 735 × 393; 71 KB
-
 16 nm pattern shift with EUV SMO.png 515 × 267; 10 KB
-
 164Er.png 413 × 738; 4 KB
-
 18mn6p37jctyxjpg.jpg 1,269 × 625; 499 KB
-
 1الحسابات المسجلة - مشروع المعرفة.png 900 × 611; 30 KB
-
 2001 NSA chart.jpg 944 × 452; 65 KB
-
 20171231-wiki-figure-png.png 2,264 × 1,057; 86 KB
-
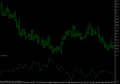
 2018-2020 Dolar Kuru Grafiği.jpg 1,262 × 447; 55 KB
-
 20191024marugame.png 452 × 395; 79 KB
-
 2020-02-05 08 53 49-Bevölkerungswachstum.ods - LibreOffice Calc.png 817 × 522; 21 KB
-
 2020-02-05 08 54 32-Bevölkerungswachstum.ods - LibreOffice Calc.png 807 × 515; 22 KB
-
 2020-02-05 08 55 58-Bevölkerungswachstum.ods - LibreOffice Calc.png 822 × 521; 23 KB
-
 20201112 refeQC.jpg 1,189 × 847; 185 KB
-
 2021-devsurvey-phabricator-histograms-satisfaction.png 389 × 284; 13 KB
-
 2023 Israel-Gaza war death toll graph.png 942 × 531; 44 KB
-
 26 07 2020 NZ cannabis referendum.png 614 × 331; 15 KB
-
 2b2t file size.png 600 × 371; 11 KB
-
 2b2t player count.png 600 × 371; 10 KB
-
 2dfpriv.jpg 670 × 226; 50 KB
-
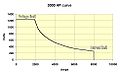 3000hp curve ver2.jpg 977 × 600; 74 KB
-
 38th Infantry Division Organization.pdf 1,575 × 1,168; 87 KB
-
 424Numeri.png 422 × 580; 36 KB
-
 50 North American Metros by proportion of density level.png 2,944 × 1,444; 159 KB
-
 505 wikipedia image.png 1,286 × 729; 15 KB
-
 7 minosegugyi eszkoz wiki.png 928 × 676; 61 KB
-
 75hwQ.jpg 246 × 241; 6 KB
-
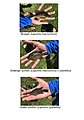
 A Chart about ant colony.jpg 2,960 × 3,948; 2.7 MB
-

-
 Aandeelhoudersstructuur Euler Hermes.PNG 797 × 377; 78 KB
-
 Abortion rates from 1990 to 2018.svg 1,162 × 494; 12 KB
-
 Abu Talib ibn Abdul Muttalib.jpg 5,001 × 3,335; 431 KB
-
 Accélération Cagiva T4 350cc.png 980 × 835; 59 KB
-
 Accélération Cagiva T4 500cc.png 980 × 835; 42 KB
-

-
 Adapter2.jpg 524 × 236; 16 KB
-
 Adapter4.jpg 524 × 236; 15 KB
-
 Adaptive Coordinate Descent illustration.png 3,219 × 1,466; 717 KB
-
 Adaptivefilter1.png 899 × 300; 10 KB
-
 AddTransaction.jpg 911 × 394; 43 KB
-
 AdemhalingModel.png 1,060 × 647; 49 KB
-
 Adenosine Receptors Down-Regulate Inflammation through a Negative Feedback Loop.png 1,300 × 2,314; 466 KB
-
 AdeosArchitecture.png 459 × 268; 9 KB
-
 AdeosInterruptPipe.png 1,263 × 217; 15 KB
-
 Admchart.jpg 3,975 × 2,584; 3.13 MB
-
 Admin command flow2.png 911 × 706; 43 KB
-
 Administracion de la cadena de suministro.jpg 800 × 506; 66 KB
-
 Administrative Setup.PNG 1,252 × 692; 106 KB
-
 ADMSmodelv1.png 1,395 × 819; 29 KB
-
 AdygheConjugation.jpg 545 × 476; 54 KB
-
 Adö111.jpg 632 × 464; 141 KB
-
 Adöadresdönüsüm111.jpg 726 × 261; 70 KB
-
 Adösatır111.jpg 499 × 112; 46 KB
-
 Afrika Carré.jpg 322 × 515; 22 KB
-
 Afrika Rectangle.jpg 424 × 471; 27 KB
-
 Afrika Triangle.jpg 498 × 530; 36 KB
-
 AGARD-B model on a sting fixture.png 1,165 × 853; 80 KB
-
 AGARD-C model on a bent sting.png 1,143 × 663; 48 KB
-
 AGARD-C model on a sting fixture.png 1,179 × 787; 84 KB
-
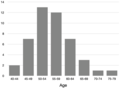 Age distribution graph United States Presidents.png 1,600 × 1,190; 180 KB
-
 Agile Unified Process Releases.png 819 × 331; 12 KB
-
 AgileJ Screenshot.png 1,333 × 872; 250 KB
-
 Agrecano.png 1,006 × 552; 53 KB
-
 Ahoi-desvda.png 1,635 × 640; 33 KB
-
 Airway on the enroute chart.jpg 811 × 243; 55 KB
-
 Alagia Fieschi's Family Lineage.png 1,144 × 397; 50 KB
-
 AmacheChart.gif 600 × 597; 144 KB
-
 Amcharts.png 160 × 160; 9 KB
-
 Amercode.png 344 × 584; 1 KB
-
 Aminoff Entropy Definition Fig 1.jpg 465 × 512; 38 KB
-
 AMTI computer processor CadillacII a.jpg 2,666 × 1,556; 602 KB
-
 Amti diagram.jpg 729 × 715; 34 KB
-

-
 Analyse moteur Cagiva T4 350cc.png 980 × 858; 48 KB
-
 Analyse moteur Cagiva T4 500cc.png 980 × 858; 47 KB
-
 Analytical Framework - 2015 Methodology for the 2016 Access to Medicine Index.jpg 1,470 × 1,104; 766 KB
-
 Ancestors Khadija (AS).jpg 2,542 × 3,563; 275 KB
-
 Anglo-SaxonKinshipTerms.png 1,921 × 810; 68 KB
-
 Animacion.png 583 × 467; 35 KB
-
 Anthropocene-GreatAccelerationEarthSystemTrends-1750-2010.png 2,602 × 1,742; 208 KB
-
 Anthropocene-GreatAccelerationSocioEconomicTrends-1750-2010.png 2,612 × 1,660; 206 KB
-
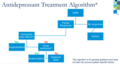 Antidepressant Treatment Algorith.png 607 × 326; 63 KB
-
 App-Downloads-Report-Reference-Cite2.png 690 × 130; 8 KB
-
 Apple chart (8232973243).jpg 2,592 × 1,944; 1.62 MB
-
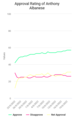 Approval Rating of Anthony Albanese, 23 May 2022 to 21 June 2022.png 720 × 1,163; 59 KB
-
 Areepubblicazionepaulbairoch.png 440 × 220; 16 KB
-
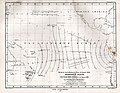 Arica Tsunami Propagation.jpg 3,168 × 2,461; 944 KB
-
 AsynchronousLearning.png 451 × 318; 65 KB
-
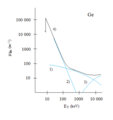 Atenuacijazracgermanijum.png 449 × 478; 9 KB
-
 ATMW.png 549 × 312; 17 KB
-
 ATR Indicator Chart.png 1,289 × 903; 12 KB
-
 Autômato previsão de desvios com 2 bits para o histórico.png 400 × 266; 81 KB
-
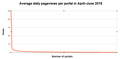 Average daily pageviews per portal in April–June 2019.png 1,658 × 817; 89 KB
-
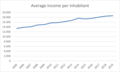 Average income Bree.png 3,006 × 1,806; 274 KB
-
 Azadi Coin price from 1979 to 2018.jpg 3,508 × 2,322; 691 KB
-
 Bad Chart.jpg 689 × 463; 64 KB
-
 Bakhdna.jpg 766 × 1,049; 520 KB
-
 BambooTypicalStressStrainHongboLi.png 480 × 330; 10 KB
-
 Basel 2012-10-06 Batch Part 3 (29).JPG 3,648 × 2,736; 3.76 MB
-
 Batu Arang coal production chart.png 1,083 × 542; 41 KB
-
 BBC faunal chart.jpg 596 × 378; 24 KB
-
 BD1.png 1,440 × 900; 222 KB
-
 Belgrave Heights Christian School Total Enrolments.png 1,920 × 1,280; 83 KB
-
 Berge bounce.v2.png 1,758 × 798; 158 KB
-
 BergeStahl's bounce between harbors.png 600 × 371; 37 KB
-
 Berlin 2019 ToT Evaluation Skills.png 1,099 × 582; 56 KB
-
 Besedilna analiza z Voyant Tools 2.png 1,024 × 768; 181 KB
-
 Bif in time.jpg 792 × 612; 37 KB
-
 Bilişsel Yanlılıklar Kodeksi.png 3,816 × 3,032; 2.67 MB
-
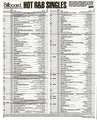 Billboard Top R&B Hits 1996.png 683 × 843; 807 KB
-
 Bitcoin-halving-price-2020.png 1,152 × 529; 90 KB
-
 Biểu đồ tăng trưởng GDP Việt Nam.png 2,051 × 1,252; 64 KB
-
 Black and white table example.png 1,839 × 1,353; 451 KB
-
 Black-body-lumens-per-watt.png 450 × 332; 14 KB
-
 BlankGraph.png 610 × 610; 118 KB
-
 Blood pressure by age graph for survey.png 1,663 × 1,003; 87 KB
-
 Bluegill, Greengill sunfish, Green sunfish comparison chart 1.jpg 2,220 × 3,180; 900 KB
-
 Borkenkäfergraph.png 1,740 × 1,246; 352 KB
-
 Breyer chart.png 1,146 × 794; 41 KB
-
 Bristol Channel early 18th century.jpg 2,231 × 1,900; 3.51 MB
-
 Bruit chalifert.jpg 952 × 676; 117 KB
-
 BTC ecosystem map.jpg 1,604 × 1,544; 327 KB
-
 Bubble16.jpg 160 × 47; 3 KB
-
 Bucharest Height Chart by Vlad Tronciu.jpg 27,500 × 1,885; 6.74 MB
-

-
 Business man with graph chart on iPad.jpg 5,000 × 2,945; 5.28 MB
-
 Cache nway.jpg 861 × 669; 92 KB
-
 Calcul Enthalpie de reaction.jpeg 1,974 × 1,281; 406 KB
-
 Cali chart2.jpg 1,452 × 930; 247 KB
-
 Canadian IRS comparative death rates.png 1,227 × 1,014; 109 KB
-
 Canadian IRS death rates.png 1,804 × 1,135; 158 KB
-
 Canadian IRS enrolment.png 1,998 × 1,200; 133 KB
-
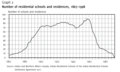 Canadian IRS number of schools and residences.png 2,025 × 1,211; 130 KB
-
 Canadian IRS TB death rates.png 1,225 × 793; 90 KB
-
 Candlestick Chart in MetaTrader 5.png 604 × 504; 2 KB
-
 Cartaorganisasi2016w.jpg 842 × 595; 487 KB
-
 Catholic Liturgical Rites.png 2,262 × 983; 250 KB
-
 Center Squeeze Example Bar Graph FPTP AMZ Percent.svg 514 × 408; 10 KB
-
 Center Squeeze Example Bar Graph RCV AMZ Percent Round 2.svg 548 × 567; 11 KB
-
 Center Squeeze Example Bar Graph RCV AMZ Percent.svg 514 × 408; 10 KB
-
 Cenymaksymalne20220215-02.png 1,024 × 768; 56 KB
-
 Cesena since 1930 new.jpg 890 × 392; 122 KB
-
 Channelcrypt.JPG 980 × 618; 48 KB
-
 Chart 1.jpg 693 × 443; 64 KB
-
 Chart display1.jpg 4,128 × 2,322; 2.28 MB
-
 Chart display2.jpg 4,128 × 2,322; 2.53 MB
-

-
 Chart indicating severity of acne Wellcome L0070354.jpg 5,600 × 3,771; 6.27 MB
-

-

-
 ChartDirector Charts.jpg 629 × 394; 62 KB
-
 Chhokangparo Elevation Profile.jpg 1,100 × 219; 41 KB
-
 City of Durham results.png 1,755 × 1,073; 100 KB
-
 Clasificación relojes y resistencia al agua.jpg 1,571 × 683; 306 KB
-
 CNS Figure 3.jpg 467 × 315; 34 KB
-
 CNS Figure 7.jpg 554 × 343; 39 KB
-
 Cognitive Bias Codex - 180+ biases, designed by John Manoogian III (jm3).jpg 1,964 × 1,570; 680 KB
-
 Cold -10.png 2,204 × 746; 60 KB
-
 CollaborationKit burndown chart 2016-05 to 2017-05.png 1,716 × 1,042; 235 KB
-
 Collatz Conjecture 100M.jpg 1,600 × 1,200; 662 KB
-
 Columbus Logistic Regression.png 882 × 496; 39 KB
-
 Column16.jpg 169 × 51; 3 KB
-
 Comm12wikigraph.jpg 989 × 539; 46 KB
-
 Common Rail Schema Aufbau.png 1,094 × 1,115; 124 KB
-

-
 Comparison of epigenetic age predictors.pdf 2,110 × 914; 9 KB
-
 Compatibilité RPCS3 oct20.png 1,624 × 865; 70 KB
-
 ComplementaryTechnologies.png 1,418 × 918; 45 KB
-
 Composition of 38th Parliament.svg 600 × 371; 43 KB
-
 Compound interest chart.png 640 × 480; 56 KB
-
 Conocimiento1 tdt 2014.png 511 × 297; 24 KB
-
 Constitution of the roman republic.jpg 2,560 × 1,440; 787 KB
-
 Contador de decada.jpg 541 × 299; 19 KB
-
 Contador de pulso crescente decrescente.JPG 567 × 295; 17 KB
-
 Contador de pulso decrescente 2.JPG 510 × 299; 14 KB
-
 Contador de pulso decrescente.JPG 510 × 299; 14 KB
-
 Contador de pulso.JPG 510 × 298; 13 KB
-
 Continuous Delivery process diagram 2.png 731 × 524; 26 KB
-
 Contraintes réglementaires s'appliquant au RAFP.png 1,042 × 990; 130 KB
-

-

-
 Copyright consent -- the 2-stage process.png 2,338 × 1,101; 249 KB
-
 Corporations in media control.gif 850 × 573; 13 KB
-
 Corrected Mutations vs log(Time).png 794 × 303; 19 KB
-
 Corrente devido a um potencial de impulso unitário.jpg 1,518 × 807; 93 KB
-
 Courbe x puissance x.PNG 997 × 637; 21 KB
-
Creating Charts With LibreOffice.webm 14 min 19 s, 1,920 × 1,080; 63.04 MB
-
 Crimechart.png 490 × 285; 30 KB
-
 Crunching the numbers (Unsplash).png 4,288 × 2,848; 12.83 MB
-
 Csv2wikichart01.png 1,320 × 856; 99 KB
-
 Csv2wikichart02.png 1,325 × 853; 109 KB
-
 Cuadro wiki.jpg 629 × 282; 35 KB
-
 Daily cases per region update 2.png 1,744 × 790; 357 KB
-
 Daily deaths per region 2.png 2,196 × 896; 409 KB

_%D8%AA%D8%BA%DB%8C%DB%8C%D8%B1%D8%A7%D8%AA_%D8%AC%D9%85%D8%B9%DB%8C%D8%AA_%D8%B4%D9%87%D8%B1_%DA%A9%DB%8C%D8%A7%D9%86.jpg)
_Distribution_of_growth_in_the_US_1917-2010.png)


.jpg)


.jpg)


.JPG)


.jpg)


.jpg)


_TightVent_Classes_A-D_and_American_(ASHRAE)_TightVent_classes_CL3,_CL6,_etc.jpg)


_of_tobacco_as_influenced_by_crop_rotation_and_chemical_treatment_of_the_soil_(Page_10)_BHL41830648.jpg)
_of_tobacco_as_influenced_by_crop_rotation_and_chemical_treatment_of_the_soil_(Page_9)_BHL41830647.jpg)


.png)


_effective_refractive_indexes_and_(b)_absorption_coefficients_of_the_electronic_chips.jpg)
_-_Scaled_(48%25).png)
.png)