Category:Our World in Data graphics about reproduction and upbringing
Jump to navigation
Jump to search
Subcategories
This category has only the following subcategory.
Media in category "Our World in Data graphics about reproduction and upbringing"
The following 69 files are in this category, out of 69 total.
-
 Amaren heriotza-tasa vs biztanleko BPGa.png 998 × 589; 120 KB
-
 Amaren heriotza-tasaren aldaketa 1990etik 2015era.png 976 × 584; 164 KB
-
 Average number of children vs child mortality, OWID.svg 850 × 600; 38 KB
-

-
 Children per woman (fertility rate) vs. level of prosperity, OWID.svg 850 × 600; 114 KB
-
 Children per woman by GDP per capita, OWID.svg 850 × 600; 34 KB
-
-
 Children per woman vs population growth, OWID.svg 850 × 600; 43 KB
-
 Children per woman vs. contraceptive prevalence, 2020.png 1,634 × 1,038; 310 KB
-
 Children per woman vs. Human Development Index, OWID.svg 850 × 600; 35 KB
-
 Children per woman, 1, OWID.svg 850 × 600; 101 KB
-
 Children per woman, OWID.svg 850 × 600; 12 KB
-

-
 Children who experience violent discipline, boys vs girls, OWID.svg 850 × 600; 17 KB
-
 Contraceptive prevalence- any methods vs modern methods, OWID.svg 850 × 600; 28 KB
-
 Crude birth rate, OWID.svg 850 × 600; 22 KB
-
 Days of paid maternity, paternity, and parental leave, 2023.jpg 1,088 × 714; 152 KB
-
 Days of paid maternity, paternity, and parental leave, 2023.png 624 × 357; 79 KB
-

-
-
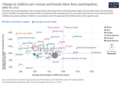
 Fertility and female labor force participation, OWID.svg 850 × 600; 100 KB
-
 Fertility and wanted fertility, OWID.svg 850 × 600; 11 KB
-
 Fertility rate of France overtime from 1800 to 2016.svg 850 × 600; 45 KB
-
 Fertility rate of Russia from 1843 to 2016.svg 850 × 600; 42 KB
-
 Fertility rate of the United Kingdom from 1541 to 2019.svg 850 × 600; 71 KB
-
 Fertility rate of the United States from 1820 to 2016.svg 850 × 600; 43 KB
-
 Fertility rate vs the share living in extreme poverty, OWID.svg 850 × 600; 28 KB
-
 Fertility rate vs. contraceptive prevalence, OWID.svg 850 × 600; 12 KB
-
 Fertility rate vs. mean years of schooling, OWID.svg 850 × 600; 24 KB
-

-
 Fertility vs wanted fertility, OWID.svg 850 × 600; 19 KB
-

-
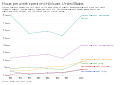
 Food expenditure as a share of family disposable income, OWID.svg 850 × 600; 10 KB
-
 Growth Rate vs Median Age, 2021.png 1,246 × 1,028; 239 KB
-

-
 Hours per week spent on child care, United States, OWID.svg 850 × 600; 9 KB
-

-
 Maternal mortality ratio vs. Fertility rate, OWID.svg 850 × 600; 42 KB
-
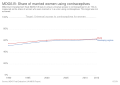 MDG5.B- Share of married women using contraceptives, OWID.svg 850 × 600; 6 KB
-
 Mdg5b-contraceptives.png 3,400 × 2,400; 282 KB
-
 Parents who agree with spanking to discipline a child, OWID.svg 850 × 600; 9 KB
-
 Participation time in household and family care per day, OWID.svg 850 × 600; 12 KB
-

-
 Preterm birth rate vs. GDP per capita, OWID.svg 850 × 600; 35 KB
-

-
 Share of women married or in a union, OWID.svg 850 × 600; 9 KB
-

-
-
 Total Fertility Rate and Labor Force Participation Rate.png 1,452 × 1,024; 322 KB
-
 Total fertility rate in 1950 and 2015 (UN), OWID.svg 850 × 600; 101 KB
-
 Total Fertility Rate of Canada from 1861 to 2016.svg 850 × 600; 40 KB
-
 Total fertility rate of Denmark overtime to 2016.svg 850 × 600; 45 KB
-
 Total fertility rate of Finland overtime to 2016.svg 850 × 600; 47 KB
-
 Total fertility rate of Germany overtime to 2016.svg 850 × 600; 43 KB
-
 Total fertility rate of Italy overtime to 2016.svg 850 × 600; 40 KB
-
 Total fertility rate of Japan overtime to 2016.svg 850 × 600; 45 KB
-
 Total fertility rate of Norway overtime to 2016.svg 850 × 600; 45 KB
-
 Total fertility rate of Poland overtime to 2016.svg 850 × 600; 45 KB
-
 Total fertility rate of Spain overtime to 2016.svg 850 × 600; 40 KB
-
 Total fertility rate of Sweden overtime to 2016.svg 850 × 600; 62 KB
-
 Total fertility rate of Ukraine overtime to 2016.svg 850 × 600; 36 KB
-

-
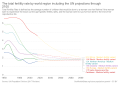
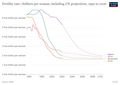 Total-fertility-rate-including-un-projections-through-2100.png 3,400 × 2,400; 465 KB
-

-
 Women participating in decisionmaking vs fertility, OWID.svg 850 × 600; 16 KB
-
 Women's educational attainment vs. fertility, OWID.svg 850 × 600; 32 KB
-

-

-
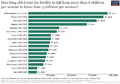 Years-it-took-Fertility-to-fall-from-6-to-below-3.png 3,000 × 2,100; 278 KB


_vs._level_of_prosperity,_OWID.svg)


,_OWID.svg)


,_OWID.svg)


),_OWID.svg)


