Category:Our World in Data graphics about wealth concentration
Jump to navigation
Jump to search
Subcategories
This category has only the following subcategory.
Media in category "Our World in Data graphics about wealth concentration"
The following 21 files are in this category, out of 21 total.
-
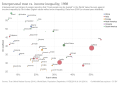
 Income inequality and growth across OECD European regions, OWID.svg 850 × 600; 20 KB
-
 Income inequality in Latin America, OWID.svg 850 × 600; 18 KB
-
 Income inequality, OWID.svg 850 × 600; 6 KB
-
 Income shares by quintile, OWID.svg 850 × 600; 10 KB
-
 Inequality in 1990 vs 2015, OWID.svg 850 × 600; 23 KB
-

-

-
 Inequality of incomes, OWID.svg 850 × 600; 13 KB
-
 Interpersonal trust vs. income inequality, OWID.svg 850 × 600; 17 KB
-
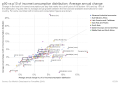
 Level-of-income-top-10-vs-bottom-10 (OWID 0571).png 850 × 600; 56 KB
-
-
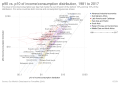 P90 vs. p10 of income-consumption distribution (Log view), OWID.svg 850 × 600; 124 KB
-
 Population by income level (World Bank), OWID.svg 850 × 600; 13 KB
-

-
 Share of Top 1% in net personal wealth, OWID.svg 850 × 600; 24 KB
-

-
 Top 1% share of net personal wealth (WID 2018), OWID.svg 850 × 600; 24 KB
-
 Top 10% income share, OWID.svg 850 × 600; 14 KB
-
 Top 10% share of net personal wealth (WID 2018), OWID.svg 850 × 600; 23 KB
-
 Top 5% income share, OWID.svg 850 × 600; 14 KB
-


.png)
,_OWID.svg)
,_OWID.svg)
,_OWID.svg)


,_OWID.svg)
,_OWID.svg)

,_OWID.svg)

,_OWID.svg)