Category:Economic inequality
Jump to navigation
Jump to search
divergence in economic well-being within a group | |||||
| Upload media | |||||
| Subclass of | |||||
|---|---|---|---|---|---|
| Facet of | |||||
| |||||
English: Economic inequality
.
Subcategories
This category has the following 13 subcategories, out of 13 total.
A
D
G
- Generalized entropy index (72 F)
I
K
- Kuznets curve (3 F)
M
P
- Pink tax (4 F)
- Poverty rates (20 F)
W
Media in category "Economic inequality"
The following 59 files are in this category, out of 59 total.
-
Banks are bastards.jpg 1,000 × 750; 114 KB
-
After tax household income in the US.svg 750 × 930; 16 KB
-
Annual air transport consumption in the UK by income quintile, 1920–2019.jpg 1,720 × 1,112; 305 KB
-
At-risk-of-poverty rate ireland 1995-2016.svg 512 × 293; 12 KB
-
Atkinson.pdf 1,239 × 1,754; 13 KB
-
Billionaire's net worth 2000-2015.png 613 × 348; 29 KB
-
Billionairs net worth 2020.jpg 686 × 610; 167 KB
-
Billionairs net worth 2021.jpg 712 × 654; 160 KB
-
Billionairs Net worth.jpg 646 × 559; 159 KB
-
Chiffres de Joseph Caillaux.png 941 × 527; 62 KB
-
Coin-equality.svg 436 × 440; 2 KB
-
Desberdintasun ekonomikoa 001.png 850 × 500; 46 KB
-
Desigualdade Econômica Global 2021 (Propriedade).svg 444 × 443; 319 KB
-
Education index UN HDR 2008.svg 940 × 477; 1.65 MB
-
Ekonomická nerovnost - tabulka.png 599 × 304; 81 KB
-
Equality-coins.svg 250 × 275; 7 KB
-
EthifyBalanceImLeben.png 1,198 × 855; 62 KB
-
ExtremelyGreedyFortyPercentPartyLogo.jpg 505 × 707; 207 KB
-
Federal tax rate by income group.png 1,071 × 657; 63 KB
-
Global changes in real income by income percentile - v1.png 977 × 512; 20 KB
-
Global Wealth Distribution 2020 (Property).svg 444 × 443; 304 KB
-
Going up or down advertisement.jpg 1,450 × 1,005; 239 KB
-
GreatGatsbyCurve.jpg 1,016 × 862; 91 KB
-
Growth of after tax household income in the US.svg 750 × 560; 15 KB
-
Historical Marginal Tax Rate for Highest and Lowest Income Earners.jpg 4,458 × 1,973; 1.3 MB
-
Indice Gini Brasil.png 2,342 × 1,633; 154 KB
-
InegalitesChancelPiketty500.jpg 500 × 474; 42 KB
-
Inheritance Tax.jpg 1,223 × 900; 296 KB
-
K-shaped recovery.png 960 × 540; 218 KB
-
Kondapur Hyderabad - view from Sri Venkateswara Nilayam.jpg 2,560 × 1,920; 1.44 MB
-
Land disparities.jpg 844 × 540; 244 KB
-
LifeChances.png 454 × 302; 26 KB
-
MM81A-1606 INV PIAPOP D3000 OP.jpg 3,872 × 2,592; 4.85 MB
-
MTR-Share1.png 836 × 546; 167 KB
-
MUMBAI DISPARITY OF LIVING.jpg 3,072 × 1,728; 856 KB
-
OECDbetterlifeindex.png 1,198 × 855; 92 KB
-
OnePercentShareOfIncome TotalUSdebt.jpg 3,713 × 3,095; 3.36 MB
-
Piedmont inequality.png 579 × 477; 52 KB
-
Poorestquintilebysurvivingondollar.jpg 738 × 481; 60 KB
-
Population veryhigh hdi.png 597 × 581; 57 KB
-
Příjmová nerovnost - graf.png 678 × 427; 31 KB
-
Répartition du patrimoine en France en 1909 par catégories.png 809 × 526; 32 KB
-
Shinagawa house boats with station high rise in back.jpg 1,944 × 2,592; 1,017 KB
-
SKHousingInequality.png 818 × 469; 22 KB
-
Squat roentgenbruecke berlin charlottenburg.png 3,720 × 2,800; 24.95 MB
-
SymmetricTheil minus Hoover.jpg 440 × 409; 51 KB
-
The Great Gatsby Curve.png 1,016 × 862; 14 KB
-
Union membership and inequality.png 645 × 468; 96 KB
-
Universidad de los Andes econ word cloud.png 1,920 × 1,200; 232 KB
-
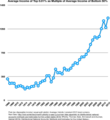
US Average Top 0.01% Income as Multiple of Average Bottom 50% Income.png 3,628 × 3,959; 455 KB
-
US Average Top 1% Income as Multiple of Average Bottom 50% Income.png 4,540 × 4,404; 519 KB
-
US high-income effective tax rates.png 744 × 549; 46 KB
-
US Wealth Inequality - v2.png 728 × 500; 48 KB
-
Wealth inequality stats from Federal Reserve.png 913 × 807; 353 KB


