Category:PDF that should be converted to SVG
Jump to navigation
Jump to search
Subcategories
This category has the following 2 subcategories, out of 2 total.
Media in category "PDF that should be converted to SVG"
The following 200 files are in this category, out of 412 total.
(previous page) (next page)-
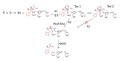 070121 Chymotrypsin.pdf 843 × 429; 838 KB
-
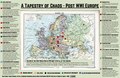 A Tapestry of Chaos - Europe in 1919.pdf 2,550 × 1,650; 1.3 MB
-
 Adaptive chart - adaptive method.pdf 545 × 439; 121 KB
-
 Affiche A4 WP15 général v1.4.pdf 1,239 × 1,752; 565 KB
-
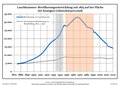
 Alterspyramide von Vintl 2001.pdf 1,239 × 1,754; 22 KB
-
 Ansiktsmaske infografikk endelig.pdf 1,239 × 1,752; 638 KB
-
 Anti-AKW-Pickerl - alle Jahre wieder.pdf 204 × 204; 170 KB
-
 Anti-AKW-Pickerl - des AKW woa mei Idee.pdf 200 × 200; 147 KB
-
 Anti-AKW-Pickerl - immer wieder.pdf 195 × 195; 249 KB
-
 Anti-AKW-Pickerl - no AKW-Future.pdf 204 × 210; 206 KB
-
 Anti-AKW-Pickerl - SCHEISS AKW.pdf 204 × 204; 182 KB
-
 Ariel University Logo.pdf 1,395 × 914; 539 KB
-
 Arrive-in-Norway-HDir-Reise-til-Norge-A3-NO.pdf 1,752 × 2,479; 55 KB
-
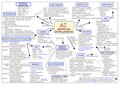 Artificial Intelligence Concept Hypermap.pdf 1,752 × 1,239; 246 KB
-
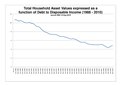 Asset Value as function of Debt to Disposable Income 1988-2010.pdf 1,752 × 1,239; 68 KB
-
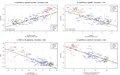
 AxionElectron.pdf 1,962 × 1,875; 1.16 MB
-
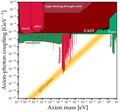 AxionPhoton.pdf 2,012 × 1,875; 1.31 MB
-
 Barra diagrama 2016 09.pdf 1,350 × 1,350; 4 KB
-
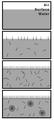
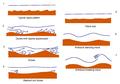 Bedforms under various flow regimes.pdf 1,183 × 822; 23 KB
-
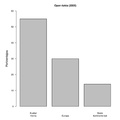
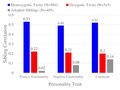 Behavioral Genetics Twin Adoption Personality Similarity.pdf 1,500 × 1,125; 8 KB
-
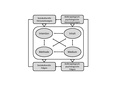 Berliner Modell als Entscheidungsmodell (nach Peterßen 2001).pdf 1,079 × 947; 12 KB
-
 Bevoelkerungsentwicklung Aue.pdf 1,754 × 1,239; 54 KB
-
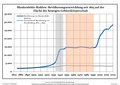
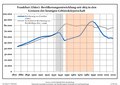
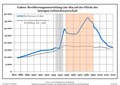
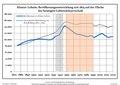
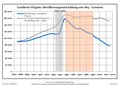
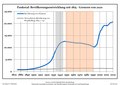
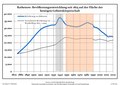
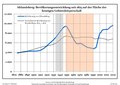 Bevölkerungsentwicklung Altlandsberg.pdf 1,752 × 1,239; 122 KB
-
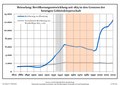
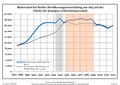
 Bevölkerungsentwicklung Amt Gransee und Gemeinden.pdf 1,752 × 1,239; 120 KB
-
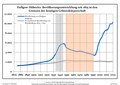
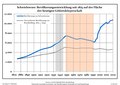
 Bevölkerungsentwicklung Amt Ortrand.pdf 1,752 × 1,239; 123 KB
-
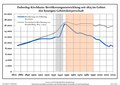
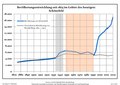
 Bevölkerungsentwicklung Amt Schlaubetal.pdf 1,752 × 1,239; 120 KB
-
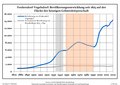
 Bevölkerungsentwicklung Angermünde.pdf 1,752 × 1,239; 123 KB
-
 Bevölkerungsentwicklung Bad Belzig.pdf 1,752 × 1,239; 122 KB
-
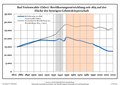 Bevölkerungsentwicklung Bad Freienwalde.pdf 1,752 × 1,239; 123 KB
-
 Bevölkerungsentwicklung Beelitz.pdf 1,752 × 1,239; 123 KB
-
 Bevölkerungsentwicklung Beeskow.pdf 1,752 × 1,239; 122 KB
-
 Bevölkerungsentwicklung Bernau.pdf 1,752 × 1,239; 119 KB
-
 Bevölkerungsentwicklung Birkenwerder.pdf 1,752 × 1,239; 120 KB
-
 Bevölkerungsentwicklung Blankenfelde-Mahlow.pdf 1,752 × 1,239; 122 KB
-
 Bevölkerungsentwicklung Brieselang.pdf 1,752 × 1,239; 121 KB
-
 Bevölkerungsentwicklung Cottbus.pdf 1,752 × 1,239; 121 KB
-
 Bevölkerungsentwicklung Dallgow-Döberitz.pdf 1,752 × 1,239; 123 KB
-
 Bevölkerungsentwicklung Doberlug-Kirchhain.pdf 1,752 × 1,239; 124 KB
-
 Bevölkerungsentwicklung Drebkau.pdf 1,752 × 1,239; 121 KB
-
 Bevölkerungsentwicklung Eberswalde.pdf 1,752 × 1,239; 120 KB
-
 Bevölkerungsentwicklung Eichwalde.pdf 1,752 × 1,239; 119 KB
-
 Bevölkerungsentwicklung Eisenhüttenstadt.pdf 1,752 × 1,239; 121 KB
-
 Bevölkerungsentwicklung Erkner.pdf 1,752 × 1,239; 122 KB
-
 Bevölkerungsentwicklung Falkensee.pdf 1,752 × 1,239; 122 KB
-
 Bevölkerungsentwicklung Fehrbellin.pdf 1,752 × 1,239; 121 KB
-
 Bevölkerungsentwicklung Finsterwalde.pdf 1,752 × 1,239; 123 KB
-
 Bevölkerungsentwicklung Forst.pdf 1,752 × 1,239; 123 KB
-
 Bevölkerungsentwicklung FrankfurtOder.pdf 1,752 × 1,239; 124 KB
-
 Bevölkerungsentwicklung Fredersdorf-Vogelsdorf.pdf 1,752 × 1,239; 122 KB
-
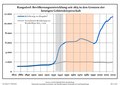
 Bevölkerungsentwicklung Fürstenberg.pdf 1,752 × 1,239; 121 KB
-
 Bevölkerungsentwicklung Fürstenwalde.pdf 1,752 × 1,239; 123 KB
-
 Bevölkerungsentwicklung Gera.pdf 1,752 × 1,239; 96 KB
-
 Bevölkerungsentwicklung Großräschen.pdf 1,752 × 1,239; 122 KB
-
 Bevölkerungsentwicklung Guben.pdf 1,752 × 1,239; 122 KB
-
 Bevölkerungsentwicklung Hennigsdorf.pdf 1,752 × 1,239; 120 KB
-
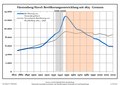
 Bevölkerungsentwicklung Herzberg Elster.pdf 1,752 × 1,239; 121 KB
-
 Bevölkerungsentwicklung Hoppegarten.pdf 1,752 × 1,239; 122 KB
-
 Bevölkerungsentwicklung Jüterbog.pdf 1,752 × 1,239; 122 KB
-
 Bevölkerungsentwicklung Karstädt.pdf 1,752 × 1,239; 122 KB
-
 Bevölkerungsentwicklung Kleinmachnow.pdf 1,752 × 1,239; 123 KB
-
 Bevölkerungsentwicklung Kloster Lehnin.pdf 1,752 × 1,239; 122 KB
-
 Bevölkerungsentwicklung Kolkwitz.pdf 1,752 × 1,239; 123 KB
-
 Bevölkerungsentwicklung Kremmen.pdf 1,752 × 1,239; 119 KB
-
 Bevölkerungsentwicklung Kyritz.pdf 1,752 × 1,239; 124 KB
-
 Bevölkerungsentwicklung KönigsWusterhausen.pdf 1,752 × 1,239; 120 KB
-
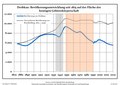
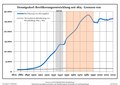
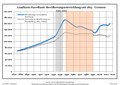
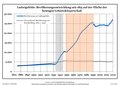
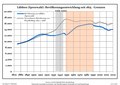
 Bevölkerungsentwicklung Land Brandenburg.pdf 1,752 × 1,239; 121 KB
-
 Bevölkerungsentwicklung Landkreis Barnim.pdf 1,752 × 1,239; 121 KB
-
 Bevölkerungsentwicklung Landkreis Dahme-Spreewald.pdf 1,752 × 1,239; 122 KB
-
 Bevölkerungsentwicklung Landkreis Elbe-Elster.pdf 1,752 × 1,239; 121 KB
-
 Bevölkerungsentwicklung Landkreis Havelland.pdf 1,752 × 1,239; 120 KB
-
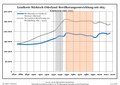 Bevölkerungsentwicklung Landkreis Märkisch-Oderland.pdf 1,752 × 1,239; 119 KB
-
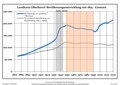 Bevölkerungsentwicklung Landkreis Oberhavel.pdf 1,752 × 1,239; 120 KB
-
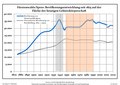
 Bevölkerungsentwicklung Landkreis Oberspreewald-Lausitz.pdf 1,752 × 1,239; 120 KB
-
 Bevölkerungsentwicklung Landkreis Oder-Spree.pdf 1,752 × 1,239; 119 KB
-
 Bevölkerungsentwicklung Landkreis Ostprignitz-Ruppin.pdf 1,752 × 1,239; 120 KB
-
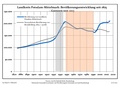 Bevölkerungsentwicklung Landkreis Potsdam-Mittelmark.pdf 1,752 × 1,239; 118 KB
-
 Bevölkerungsentwicklung Landkreis Prignitz.pdf 1,752 × 1,239; 121 KB
-
 Bevölkerungsentwicklung Landkreis Spree-Neiße.pdf 1,752 × 1,239; 118 KB
-
 Bevölkerungsentwicklung Landkreis Teltow-Fläming.pdf 1,752 × 1,239; 122 KB
-
 Bevölkerungsentwicklung Landkreis Uckermark.pdf 1,752 × 1,239; 120 KB
-
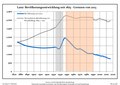 Bevölkerungsentwicklung Lanz.pdf 1,752 × 1,239; 118 KB
-
 Bevölkerungsentwicklung Lauchhammer.pdf 1,752 × 1,239; 122 KB
-
 Bevölkerungsentwicklung Leegebruch.pdf 1,752 × 1,239; 119 KB
-
 Bevölkerungsentwicklung Liebenwalde.pdf 1,752 × 1,239; 120 KB
-
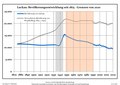 Bevölkerungsentwicklung Luckau.pdf 1,752 × 1,239; 119 KB
-
 Bevölkerungsentwicklung Luckenwalde.pdf 1,752 × 1,239; 123 KB
-
 Bevölkerungsentwicklung Ludwigsfelde.pdf 1,752 × 1,239; 122 KB
-
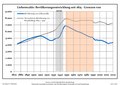
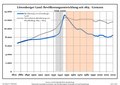 Bevölkerungsentwicklung Löwenberger Land.pdf 1,752 × 1,239; 121 KB
-
 Bevölkerungsentwicklung Lübben.pdf 1,752 × 1,239; 122 KB
-
 Bevölkerungsentwicklung Lübbenau.pdf 1,752 × 1,239; 123 KB
-
 Bevölkerungsentwicklung Michendorf.pdf 1,752 × 1,239; 122 KB
-
 Bevölkerungsentwicklung Mittenwalde.pdf 1,752 × 1,239; 119 KB
-
 Bevölkerungsentwicklung Mühlenbecker Land.pdf 1,752 × 1,239; 120 KB
-
 Bevölkerungsentwicklung Müncheberg.pdf 1,752 × 1,239; 122 KB
-
 Bevölkerungsentwicklung Nauen.pdf 1,752 × 1,239; 121 KB
-
 Bevölkerungsentwicklung Neuenhagen.pdf 1,752 × 1,239; 122 KB
-
 Bevölkerungsentwicklung Neuruppin.pdf 1,752 × 1,239; 123 KB
-
 Bevölkerungsentwicklung Oberkrämer.pdf 1,752 × 1,239; 120 KB
-
 Bevölkerungsentwicklung Oranienburg.pdf 1,752 × 1,239; 121 KB
-
 Bevölkerungsentwicklung Panketal.pdf 1,752 × 1,239; 119 KB
-
 Bevölkerungsentwicklung Perleberg.pdf 1,752 × 1,239; 122 KB
-
 Bevölkerungsentwicklung Petershagen-Eggersdorf.pdf 1,752 × 1,239; 122 KB
-
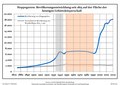
 Bevölkerungsentwicklung Potsdam.pdf 1,752 × 1,239; 123 KB
-
 Bevölkerungsentwicklung Premnitz.pdf 1,752 × 1,239; 122 KB
-
 Bevölkerungsentwicklung Prenzlau.pdf 1,752 × 1,239; 121 KB
-
 Bevölkerungsentwicklung Pritzwalk.pdf 1,752 × 1,239; 124 KB
-
 Bevölkerungsentwicklung Rangsdorf.pdf 1,752 × 1,239; 121 KB
-
 Bevölkerungsentwicklung Rathenow.pdf 1,752 × 1,239; 123 KB
-
 Bevölkerungsentwicklung Rheinsberg.pdf 1,752 × 1,239; 123 KB
-
 Bevölkerungsentwicklung Rüdersdorf.pdf 1,752 × 1,239; 122 KB
-
 Bevölkerungsentwicklung Schorfheide.pdf 1,752 × 1,239; 120 KB
-
 Bevölkerungsentwicklung Schulzendorf.pdf 1,752 × 1,239; 121 KB
-
 Bevölkerungsentwicklung Schwedt.pdf 1,752 × 1,239; 123 KB
-
 Bevölkerungsentwicklung Schwielowsee.pdf 1,752 × 1,239; 123 KB
-
 Bevölkerungsentwicklung Schönefeld.pdf 1,752 × 1,239; 121 KB
-
 Bevölkerungsentwicklung Schöneiche.pdf 1,752 × 1,239; 123 KB
-
 Bevölkerungsentwicklung Schönwalde-Glien.pdf 1,752 × 1,239; 122 KB
-
 Bevölkerungsentwicklung Seelow.pdf 1,752 × 1,239; 122 KB
-
 Bevölkerungsentwicklung Senftenberg.pdf 1,752 × 1,239; 122 KB
-
 Bevölkerungsentwicklung Spremberg.pdf 1,752 × 1,239; 123 KB
-
 Bevölkerungsentwicklung Stadt Brandenburg.pdf 1,752 × 1,239; 122 KB
-
 Bevölkerungsentwicklung Strausberg.pdf 1,752 × 1,239; 121 KB
-
 Bevölkerungsentwicklung Teltow.pdf 1,752 × 1,239; 123 KB
-
 Bevölkerungsentwicklung Templin.pdf 1,752 × 1,239; 123 KB
-
 Bevölkerungsentwicklung Velten.pdf 1,752 × 1,239; 119 KB
-
 Bevölkerungsentwicklung Vetschau.pdf 1,752 × 1,239; 124 KB
-
 Bevölkerungsentwicklung Wandlitz.pdf 1,752 × 1,239; 119 KB
-
 Bevölkerungsentwicklung Werder.pdf 1,752 × 1,239; 123 KB
-
 Bevölkerungsentwicklung Werneuchen.pdf 1,752 × 1,239; 121 KB
-
 Bevölkerungsentwicklung Wildau.pdf 1,752 × 1,239; 120 KB
-
 Bevölkerungsentwicklung Wittenberge.pdf 1,752 × 1,239; 122 KB
-
 Bevölkerungsentwicklung Wittstock.pdf 1,752 × 1,239; 124 KB
-
 Bevölkerungsentwicklung Woltersdorf.pdf 1,752 × 1,239; 122 KB
-
 Bevölkerungsentwicklung Wriezen.pdf 1,752 × 1,239; 122 KB
-
 Bevölkerungsentwicklung Wustermark.pdf 1,752 × 1,239; 122 KB
-
 Bevölkerungsentwicklung Zehdenick.pdf 1,752 × 1,239; 119 KB
-
 Bevölkerungsentwicklung Zeuthen.pdf 1,752 × 1,239; 119 KB
-
 Bevölkerungsentwicklung Zossen.pdf 1,752 × 1,239; 121 KB
-
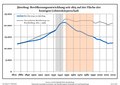
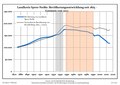
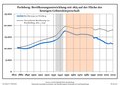
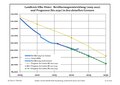
 Bevölkerungsprognosen Birkenwerder.pdf 1,752 × 1,239; 67 KB
-
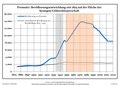
 Bevölkerungsprognosen Fürstenberg.pdf 1,752 × 1,239; 68 KB
-
 Bevölkerungsprognosen Landkreis Elbe-Elster.pdf 1,752 × 1,239; 67 KB
-
 Bevölkerungsprognosen Leegebruch.pdf 1,752 × 1,239; 68 KB
-
 Bevölkerungsprognosen Schwedt.pdf 1,752 × 1,239; 125 KB
-
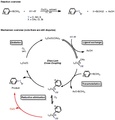
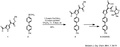
 Biological Target Prediction of Bioactive Molecules Based on Minimum Structures Identification.pdf 17,833 × 12,614; 1.31 MB
-
 Blasensp.pdf 1,239 × 1,752; 220 KB
-
 Bodysizes germany2006 histogram.pdf 1,200 × 900; 22 KB
-
 BrnBld LaptevTopo.pdf 760 × 754; 48 KB
-
 Carpet Elements English.pdf 852 × 758; 20 KB
-
 Carta Occitania.pdf 1,179 × 1,002; 520 KB
-
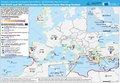
 Carta ocean e mars europa oc.pdf 1,752 × 1,239; 987 KB
-
 CarteHAZARI.pdf 1,079 × 943; 124 KB
-
 Cartes GL Juillet 2016 Impact report.pdf 1,239 × 1,754; 150 KB
-
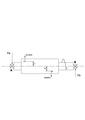
 CERNSPSExp.pdf 3,527 × 1,550; 171 KB
-
 Cesto de viagem.pdf 1,752 × 1,239; 66 KB
-
 Champagne coupe 2.pdf 627 × 677; 46 KB
-
 ChanLamCouplingReaction1.pdf 1,045 × 1,089; 35 KB
-
 Chanlamreactionexamplebellstein.pdf 1,339 × 529; 30 KB
-
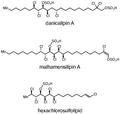 Chlorosulfolipids.pdf 689 × 658; 16 KB
-
 Ciclo Di Kolb.pdf 1,500 × 1,125; 94 KB
-
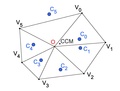 Circumcenter of mass.pdf 1,447 × 1,097; 12 KB
-
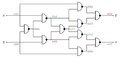
 Clock-Master.pdf 1,420 × 797; 50 KB
-
 CMC.pdf 337 × 750; 110 KB
-
 CMYK Spectrum printed paper.pdf 1,527 × 883; 172 KB
-
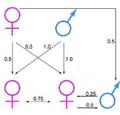
 Coefficient d'apparentement d'organismes diploïdes (1).pdf 872 × 885; 19 KB
-
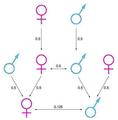
 Coefficientd'apparentementdeterminationhaplo-diplïde (1).pdf 910 × 868; 70 KB
-
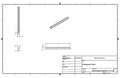
 COLD SLUG WELLS.pdf 1,754 × 1,239, 2 pages; 7 KB
-
 Complex Morse Lemma Illustration.pdf 1,125 × 1,500; 1.36 MB
-
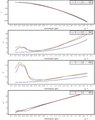 Complex permittivity and refractive index for Au.pdf 929 × 1,175; 130 KB
-
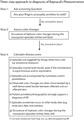 Consensus Diagnostic Criteria Raynaud's Phenomenon.pdf 727 × 1,039; 16 KB
-
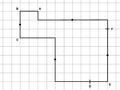 Conway criterion prototile.pdf 1,500 × 1,125; 16 KB
-
 Coral ciclos 2.pdf 1,500 × 1,125; 111 KB
-
 Correlates of TFR.pdf 2,400 × 1,500; 15 KB
-
 COVID19-Disease-Map-project-icon.pdf 600 × 556; 3 KB
-
 Crossover nand.pdf 795 × 383; 22 KB
-
 CrumeyFig4.pdf 1,350 × 1,066; 37 KB
-
 D=.5 pentagonal prism 10-2-14.pdf 2,550 × 1,650; 54 KB
-
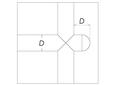
 D=.5 rectangular prism 11-5-14 drawings.pdf 2,550 × 1,650; 58 KB
-
 D=.5 triangular prism 11-5-14 drawings.pdf 2,550 × 1,650; 58 KB
-
 Dangling malloc j.pdf 1,597 × 587; 23 KB
-
 Dangling Pointer - Storing a value into j.pdf 1,597 × 587; 23 KB
-
 Dangling store i.pdf 1,691 × 587; 23 KB
-
 Danicalipin A..pdf 889 × 1,341; 24 KB
-
 DB Regio NRW.pdf 958 × 539; 1.31 MB
-
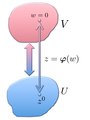
 DiagFuncMacroSyst.pdf 1,239 × 1,752; 69 KB
-
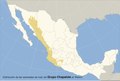 Distribución de las variedades de maiz del grupo chapalote en mexico.pdf 2,031 × 1,362; 919 KB
-
 District of Columbia for Warren placards.pdf 1,650 × 1,275, 3 pages; 831 KB
-
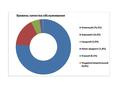
 Divicion Electoral por Partidos.pdf 1,754 × 1,239; 57 KB
-
 Doc123.pdf 1,752 × 1,239; 244 KB
-
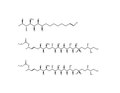 DSP-chlorosulfolipids.pdf 1,650 × 1,275; 21 KB
-
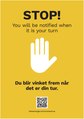 Ear-test-center-Stop-OERJE-TESTSENTER-STOPPSKILT.pdf 4,220 × 5,991; 503 KB
-
 ECDM 20221107 TS Tsunami Early Warning.pdf 1,625 × 1,125; 535 KB
-
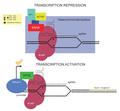 EffectorWiki.pdf 6,900 × 6,366; 393 KB
-
 Ensemble Paulinum Jahresprogramm 2011.pdf 1,239 × 618, 9 pages; 1.54 MB
-

-
 Equil.pdf 1,239 × 1,754; 10 KB
-
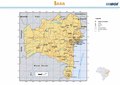 Estado-da-Bahia-Mapa-Escolar-IBGE-Brasil.pdf 1,752 × 1,239; 1.21 MB
-
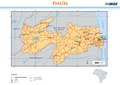 Estado-da-Paraiba-PB-Mapa-Escolar-IBGE-Brasil.pdf 1,752 × 1,239; 1.88 MB
-
 Estado-de-Alagoas-Mapa-Escolar-IBGE-Brasil.pdf 1,752 × 1,239; 997 KB
-
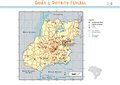 Estado-de-Goias-GO-e-o-Distrito-Federal-DF-Mapa-Escolar-IBGE-Brasil.pdf 1,752 × 1,239; 4.88 MB
-
 Estado-de-Minas-Gerais-MG-Mapa-Escolar-IBGE-Brasil.pdf 1,752 × 1,239; 1.55 MB