Category:Paleoclimatology
Jump to navigation
Jump to search
study of changes in climate taken on the scale of the entire history of Earth  | |||||
| Upload media | |||||
| Instance of | |||||
|---|---|---|---|---|---|
| Subclass of | |||||
| |||||
Subcategories
This category has the following 14 subcategories, out of 14 total.
A
- Alkenone biolipids (4 F)
C
- Climate of Cretaceous (44 F)
D
I
M
- Melissa Berke (1 F)
P
- Proxy (climate) (10 F)
S
W
- WAIS Divide (34 F)
Media in category "Paleoclimatology"
The following 104 files are in this category, out of 104 total.
-
 "EDC TempCO2Dust".svg 886 × 709; 573 KB
-
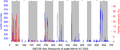
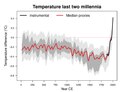
 2000 Year Temperature Comparison 2015 update.png 750 × 553; 75 KB
-
 400 Kyr Eccentrictiy.png 768 × 576; 300 KB
-
 400kyr cycles.png 768 × 672; 265 KB
-
 Africa Climate 14000bp.png 1,320 × 1,320; 124 KB
-
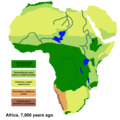 Africa Climate 7000bp.png 1,320 × 1,320; 210 KB
-
 Antarctic snow pit.jpg 3,648 × 2,736; 1.82 MB
-
 Benthic delta o18 3500 0 ka bp 1.svg 1,415 × 609; 59 KB
-
 Benthic delta o18 3500 0 ka bp 2.svg 1,415 × 609; 49 KB
-
 Benthic delta o18 5500 0 ka bp 1.svg 1,442 × 609; 49 KB
-
 Benthic delta o18 5500 0 ka bp 2.svg 1,415 × 609; 46 KB
-
 Benthic do18 53-00 ma 1.svg 1,440 × 720; 76 KB
-
 Biogeographic timetable of Madagascar - journal.pone.0062086.g003.png 2,925 × 4,163; 5.95 MB
-

-
 Bolling allegrod ngrip oxygen isotope image 1.svg 1,620 × 630; 248 KB
-
 Carbon dioxide variation 450 thousand years.png 1,668 × 783; 119 KB
-
 Cenozoic climate.jpg 500 × 198; 24 KB
-
 Cenozoic deep sea temperature.jpg 1,280 × 555; 78 KB
-
 Change in ocean conditions from the last interglacial to the modern day.png 546 × 1,022; 105 KB
-
 Climat nature.pdf 1,239 × 1,754, 206 pages; 1.64 MB
-
 Cretaceous ocean currents 93 ma 1.svg 1,409 × 797; 420 KB
-
 Dye 3 w.jpg 6,072 × 4,847; 4.53 MB
-

-
 Earth hothouse 1.webp 1,200 × 1,200; 48 KB
-
 Earth icehouse 1.webp 1,200 × 1,200; 58 KB
-
 Edml ice code delta t 140000-0 bp 1.svg 1,620 × 519; 77 KB
-
 Egrip acidity 13000 0 bp 1.svg 1,196 × 557; 74 KB
-
 Epica ice code delta t 12000-0 bp 1.svg 1,443 × 607; 43 KB
-
 Epica ice code delta t 140000-0 bp 1.svg 1,412 × 585; 51 KB
-
 Epica ice code delta t 16000-0 bp 1.svg 1,412 × 612; 34 KB
-
 Epica ice code delta t 60000-0 bp 1.svg 1,412 × 612; 37 KB
-

-
 Evolution of the composition of the terrestrial atmosphere.gif 386 × 249; 4 KB
-
 Gisp2 electrical conductivity 1.jpg 1,100 × 421; 52 KB
-
 GlaciationsinEarthExistancelicenced.jpg 829 × 64; 25 KB
-
 Grip deltao18 112000-0 bp 1.svg 1,475 × 435; 92 KB
-
 Grip deltao18 112000-50000 bp 1.svg 1,475 × 437; 73 KB
-
 Grip deltao18 112000-70000 bp 1.svg 1,475 × 437; 68 KB
-
 Grip deltao18 16000-0 bp 1.svg 1,475 × 437; 49 KB
-
 Grip deltao18 75000-50000 bp 1.svg 1,475 × 437; 55 KB
-
 H-events.png 3,938 × 1,642; 207 KB
-
 H1-ba boundary 1.svg 859 × 568; 42 KB
-
 H1-stadial ngrip delta o18 1.svg 1,620 × 630; 226 KB
-
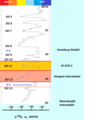 Hengelo.png 607 × 746; 28 KB
-
 Huneborg.PNG 520 × 746; 27 KB
-
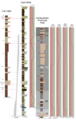
 Ice core drill head.jpg 2,994 × 2,848; 1.03 MB
-
 Ice core drill.jpg 3,264 × 2,448; 2.27 MB
-
 Ischigualasto stratigraphy and climate trends.png 1,772 × 2,788; 1.66 MB
-
 Lascaux interstadial ngrip delta o18 1.svg 1,620 × 630; 307 KB
-
 Late glacial temperature curve bolling2.png 1,600 × 766; 329 KB
-
 Laugerie interstadial ngrip delta o18 1.svg 1,620 × 630; 166 KB
-
 Lgm ngrip delta-o18 accurate 1.svg 1,620 × 630; 252 KB
-
 Lgm ngrip delta-o18 accurate 2.svg 1,620 × 630; 437 KB
-
 Mis11 mbe.png 1,181 × 945; 266 KB
-
 Mis11.png 1,181 × 945; 288 KB
-
 Molecular structures and HPLC detection of GDGTs.jpg 926 × 469; 47 KB
-
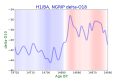
 Ngrip bolling allerod ca2plus 1.png 1,200 × 720; 64 KB
-
 Ngrip bolling allerod ch4 1.png 924 × 614; 58 KB
-
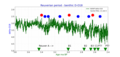
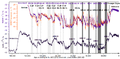
 Ngrip data 50yrs 1.svg 1,350 × 450; 178 KB
-
 Ngrip deltao18 10000 0 1.svg 1,448 × 659; 32 KB
-
 Ngrip deltao18 10000 0 2.svg 1,448 × 659; 41 KB
-
 Ngrip deltao18 12000 0 1.svg 1,448 × 659; 34 KB
-
 Ngrip deltao18 12000 6000 bp 1.svg 1,448 × 659; 32 KB
-
 Ngrip deltao18 12000 8000 1.svg 1,448 × 659; 28 KB
-
 Ngrip deltao18 15000 0 1.svg 1,414 × 663; 33 KB
-
 Ngrip deltao18 50000 100000 1.svg 1,457 × 495; 46 KB
-
 Ngrip deltao18 55000 75000 1.svg 1,457 × 495; 34 KB
-
 Ngrip deltao18 70000 120000 1.svg 1,457 × 495; 45 KB
-
 Ngrip deltao18 middle weichselian 48000 10000 1.svg 1,620 × 630; 673 KB
-
 Ngrip deltao18 middle weichselian 48000 28000 1.svg 1,620 × 630; 456 KB
-
 Ngrip deltao18 middle weichselian 48000 40000 1.svg 1,620 × 630; 300 KB
-
 Ngrip deltao18 middle weichselian 49000 35000 1.svg 1,620 × 630; 387 KB
-
 Ngrip deltao18 middle weichselian 59000 10000 1.svg 1,620 × 630; 745 KB
-
 Ngrip deltao18 middle weichselian 59000 30000 1.svg 1,620 × 630; 545 KB
-
 Ngrip deltao18 middle weichselian 59000 45000 1.svg 1,620 × 630; 372 KB
-
 Ngrip deltao18 preboreal 11700 10500 1.svg 1,620 × 630; 161 KB
-
 Ngrip deltao18 preboreal 12000 10000 1.svg 1,620 × 630; 202 KB
-
 Ngrip lateglacial do18 1.png 640 × 480; 10 KB
-
 Ngrip oxygen isotope data last glacial 1.svg 1,457 × 495; 64 KB
-
 Ngrip yd pb do18 ch4 2.png 1,114 × 604; 120 KB
-
 Ngrip-epica-do18.png 981 × 567; 11 KB
-
 Ngrip1 deltao18 8400-8000 bp 1.svg 1,517 × 679; 63 KB
-
 Ngrip1 deltao18 9800-0 bp 1.svg 1,517 × 679; 797 KB
-
 Ngrip2 delta o18 11800 11600 bp 1.svg 1,244 × 694; 43 KB
-
 Ngrip2 delta o18 12000 10000 bp 1.svg 1,244 × 694; 72 KB
-
 Ngrip2 delta o18 13000 10000 bp 1.svg 1,244 × 694; 61 KB
-
 Ngrip2 delta o18 16000 0 bp 1.svg 1,223 × 677; 90 KB
-
 Ngrip20 yd pb 2.png 1,600 × 766; 207 KB
-
 Pbo2.jpg 985 × 647; 135 KB
-
 Periods of eccentricity versus time.jpg 1,936 × 2,243; 279 KB
-
 Pianosa Interglacial deposits.jpg 4,000 × 3,000; 4.21 MB
-
 Preboreal grip oxygen isotope curve 1.svg 923 × 607; 24 KB
-
 Present day ocean currents simulated 1.png 1,154 × 712; 280 KB
-
 Pretiglian curve lisiecki raymo 2005 1.png 1,600 × 766; 141 KB
-
 Reuverian curve zachos 2001 raw data.PNG 1,600 × 766; 179 KB
-
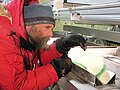 Scientist examines an ice core.jpg 3,264 × 2,448; 1.55 MB
-
 Sea currents hot house 2.PNG 1,200 × 1,200; 102 KB
-
 Sea currents ice house 2.PNG 1,200 × 1,200; 182 KB
-
 Temperature reconstruction last two millennia.pdf 1,272 × 975; 58 KB
-
 VostokIceCore.jpg 1,366 × 604; 88 KB
-
 WikiHpositionNGRIPenviolet LtoR.png 3,621 × 1,792; 235 KB
-
 WikiHpositionNGRIPfrTimeLtoR.png 3,621 × 1,797; 235 KB
-
 Yd pb boundary 2.svg 813 × 554; 57 KB
-
 Younger Dryas-Preboreal boundary on Ngrip 50 dataset.png 1,527 × 797; 310 KB


_MAT_and_(b)_MAP_estimates.png)


