File:2018-Opioid-Deaths-By-Type-US-He.png
Jump to navigation
Jump to search

Size of this preview: 800 × 487 pixels. Other resolutions: 320 × 195 pixels | 640 × 390 pixels | 1,150 × 700 pixels.
Original file (1,150 × 700 pixels, file size: 69 KB, MIME type: image/png)
Captions
Captions
Add a one-line explanation of what this file represents
Summary[edit]
| Description |
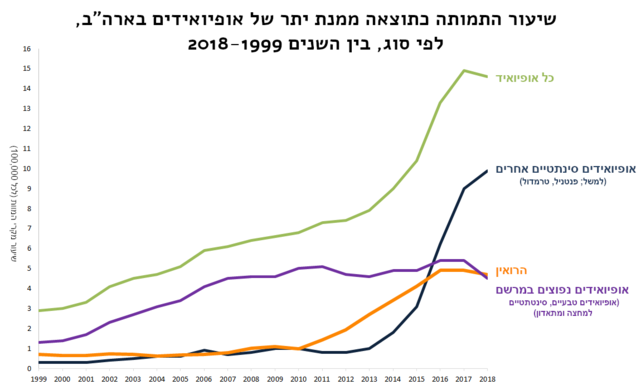
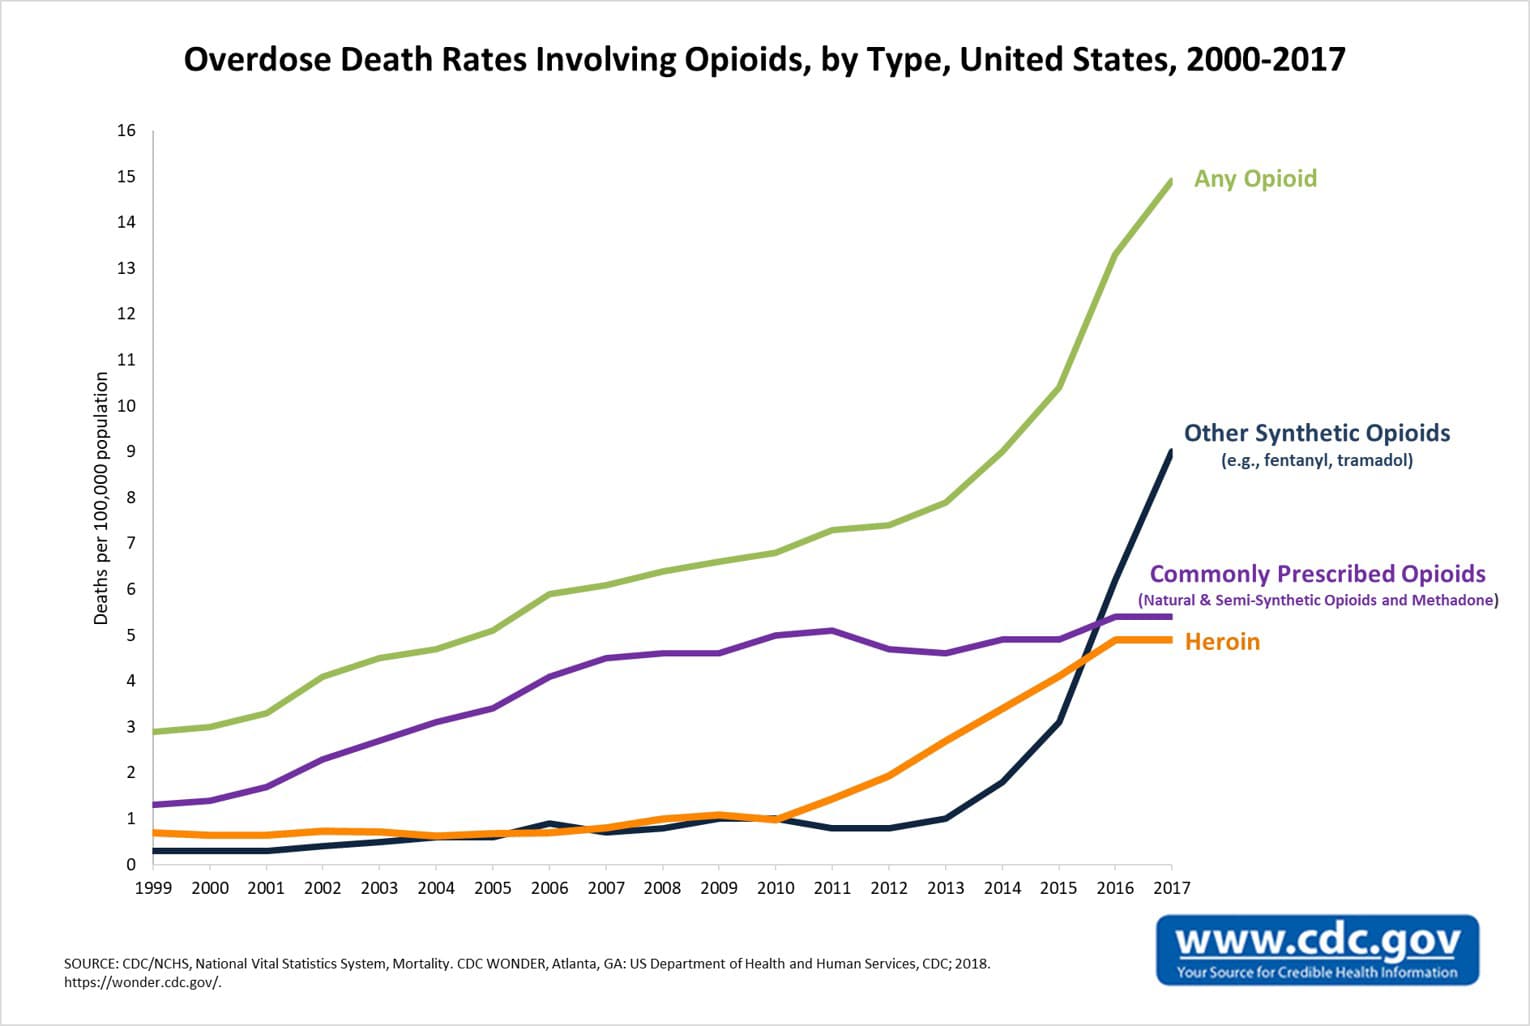
English: Timeline graph of overdose deaths involving opioids, United States. Deaths per 100,000 population. |
|||
| Date | - Date the chart was first uploaded to the Commons. See file history for dates of later uploads. | |||
| Source | 2000-2017 chart. From Opioid Data Analysis and Resources. Drug Overdose. CDC Injury Center. Click on "Rising Rates" tab. See also: 2000-2016 chart. | |||
| Author | Centers for Disease Control and Prevention. Original chart was cropped by User:Timeshifter. Freeware IrfanView was used. | |||
| Permission (Reusing this file) |
|
|||
| Other versions |
See: |
Licensing[edit]
This file is licensed under the Creative Commons Attribution-Share Alike 4.0 International license.
- You are free:
- to share – to copy, distribute and transmit the work
- to remix – to adapt the work
- Under the following conditions:
- attribution – You must give appropriate credit, provide a link to the license, and indicate if changes were made. You may do so in any reasonable manner, but not in any way that suggests the licensor endorses you or your use.
- share alike – If you remix, transform, or build upon the material, you must distribute your contributions under the same or compatible license as the original.
File history
Click on a date/time to view the file as it appeared at that time.
| Date/Time | Thumbnail | Dimensions | User | Comment | |
|---|---|---|---|---|---|
| current | 14:22, 18 February 2021 | | 1,150 × 700 (69 KB) | Matankic (talk | contribs) | m |
| 14:17, 18 February 2021 |  | 1,208 × 803 (71 KB) | Matankic (talk | contribs) | =={{int:filedesc}}== {{Information |description={{en|1=Timeline graph of overdose deaths involving opioids, United States. Deaths per 100,000 population.}} |date=2021-02-18 - Date the chart was first uploaded to the Commons. See file history for dates of later uploads. |source=[https://www.cdc.gov/drugoverdose/images/data/OpioidDeathsByTypeUS.PNG 2000-2017 chart]. From [https://www.cdc.gov/drugoverdose/data/analysis.html Opioid Data Analysis and Resources. Drug Overdose.... |
You cannot overwrite this file.
File usage on Commons
There are no pages that use this file.
File usage on other wikis
The following other wikis use this file:
- Usage on he.wikipedia.org