File:Polarisation (Elliptical).svg
跳转到导航
跳转到搜索

此SVG文件的PNG预览的大小:240 × 600像素。 其他分辨率:96 × 240像素 | 192 × 480像素 | 307 × 768像素 | 409 × 1,024像素 | 819 × 2,048像素 | 250 × 625像素。
原始文件 (SVG文件,尺寸为250 × 625像素,文件大小:11 KB)
说明
说明
添加一行文字以描述该文件所表现的内容
| 描述 |
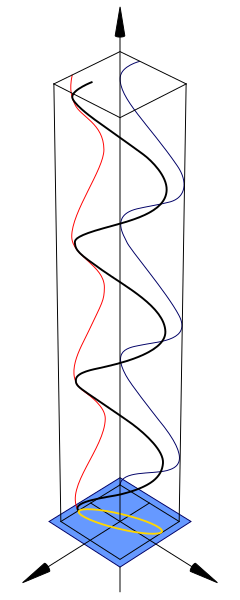
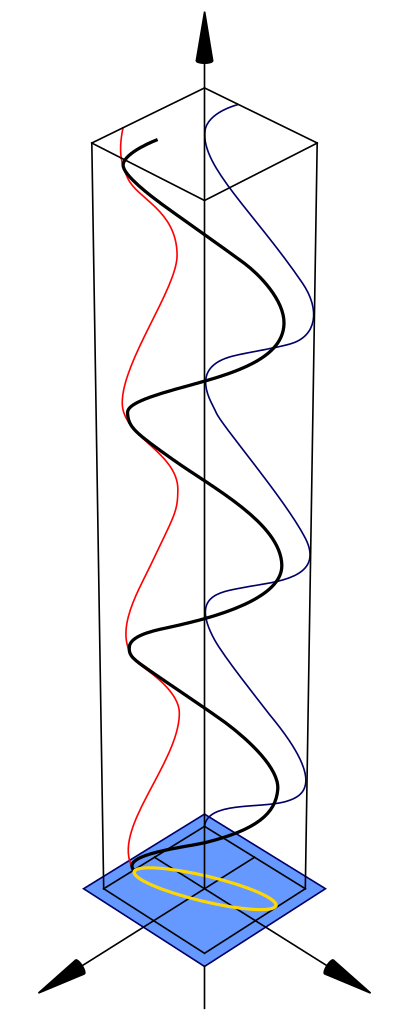
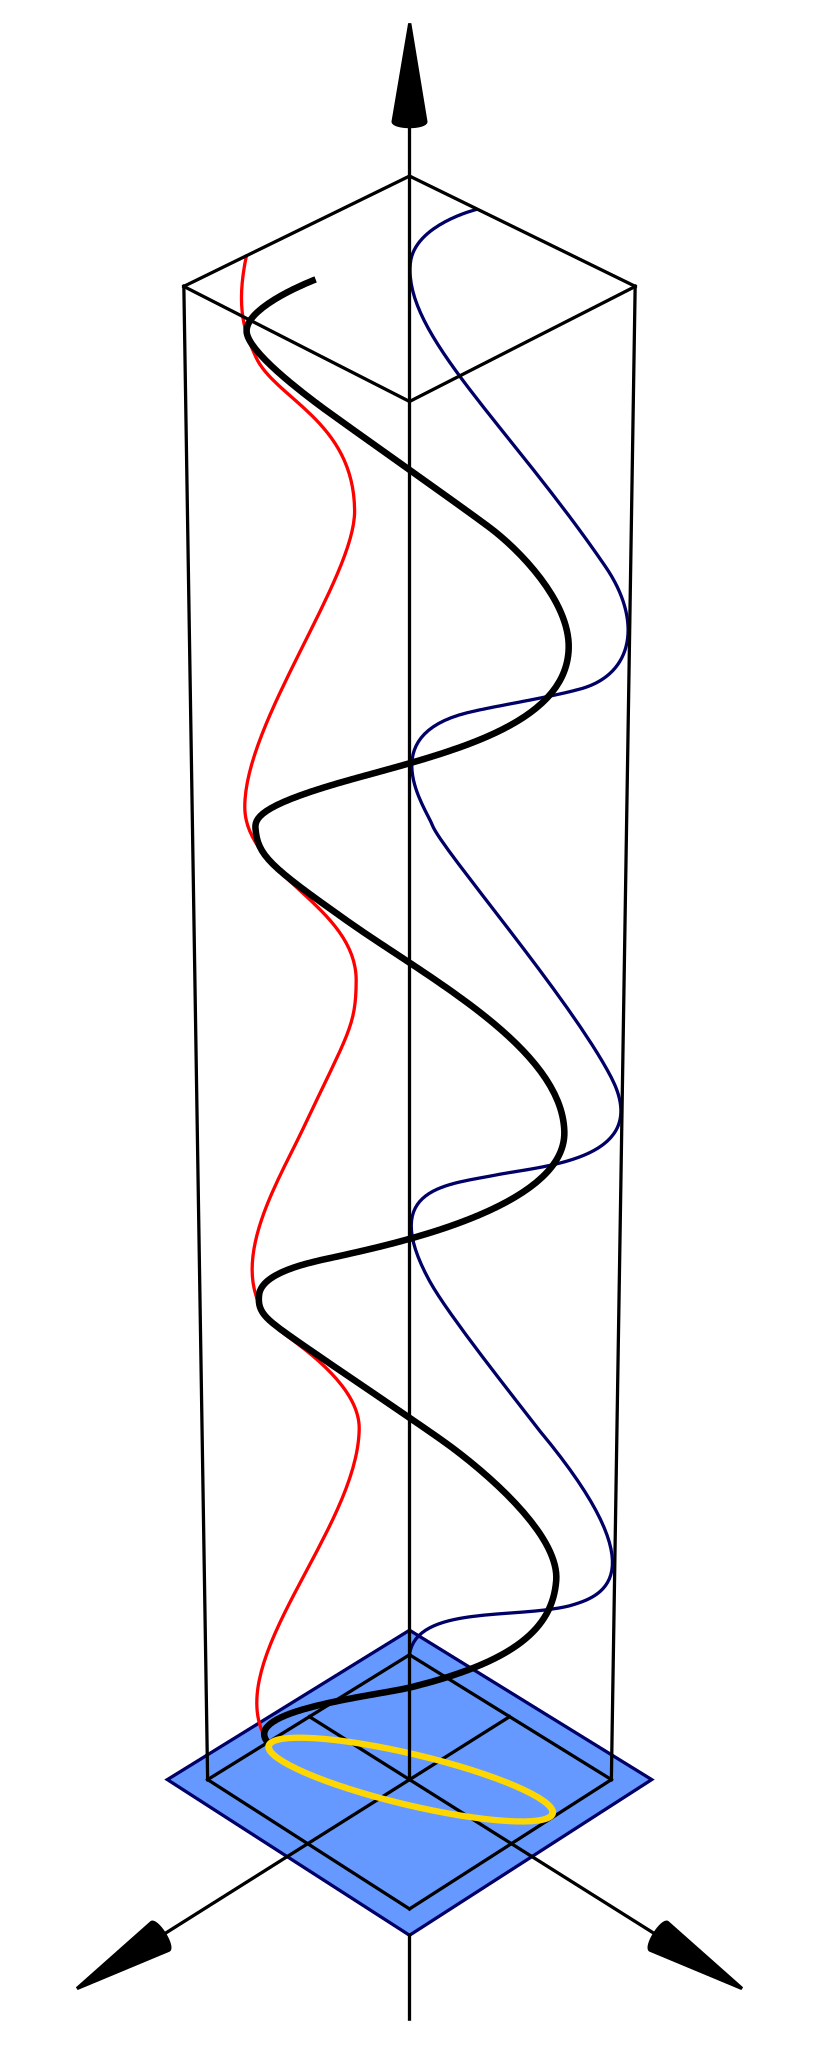
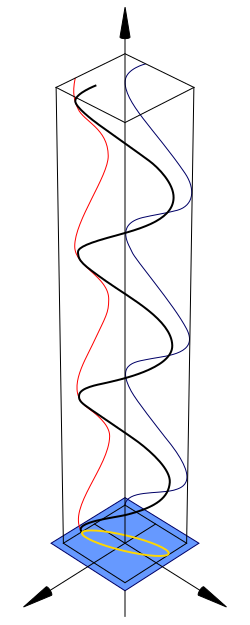
English: Diagram of elliptical polarisation of electromagnetic radiation |
||
| 日期 | 12/02/07 | ||
| 来源 |
Own drawing down in Mathematica, edited in Inkscape. |
||
| 作者 | Inductiveload | ||
| 授权 (二次使用本文件) |
|
||
| 其他版本 | Linear polarisation |
.svg)
.svg)
Mathematica Code
[编辑].svg&action=edit§ion=1)
This figure requires the use of Arrow3D, which is not included in the StandardPackages (as of Feb 2007). This can be obtained from Wolfram Research at this location. The required packages are:
<< Graphics`
<< Arrow3D`Arrow3D`
The code is:
wavefunction=ParametricPlot3D[{0.5 Sin[4t+1],-Sin[4t],t},{t,0,5},
    BoxRatios\[Rule]{1,
      1,4},ImageSize\[Rule]400,Boxed\[Rule]False,Axes\[Rule]False,
      PlotPoints\[Rule]60,ViewPoint->{2,2, 2},PlotRange\[Rule]All]

repsi=ParametricPlot3D[{0.5 Sin[4t+1],-1,t,RGBColor[1,0,0]},{t,0,5},
      BoxRatios\[Rule]{4,1,1},ImageSize\[Rule]500,
      Boxed\[Rule]False,Axes\[Rule]False,
        PlotPoints\[Rule]60,PlotRange\[Rule]All]

impsi=ParametricPlot3D[{-1,-Sin[4t],t,RGBColor[0,0,102/255]},{
    t,0,5},BoxRatios\[Rule]{4,1,1},ImageSize\[Rule]500,Boxed\[Rule]False,
      Axes\[Rule]False,PlotPoints\[Rule]60,PlotRange\[Rule]All]

end=ParametricPlot3D[{0.5 Sin[t+1],-Sin[t],0},{t,0,2π},BoxRatios\[Rule]{4,1,1},
    ImageSize\[Rule]500,Boxed\[Rule]False,Axes\[Rule]False,
      PlotPoints\[Rule]10,PlotRange\[Rule]All]

xaxis=Graphics3D[Arrow3D[{0,0,-1},{
  0,0,6},HeadSize \[Rule] UniformSize[.5],HeadColor\[Rule]Black]]

uaxis=Graphics3D[Arrow3D[{0,-1,0},{0,3,0},HeadSize \[Rule]
    UniformSize[.5],HeadColor\[Rule]Black]]

vaxis=Graphics3D[Arrow3D[{-1,0,0},{3,0,0},HeadSize \[Rule]
      UniformSize[.5],HeadColor\[Rule]Black]]

plane=Graphics3D[Polygon[{{1.2,1.2,0},{1.2,-1.2,0},{-1.2,-1.2,0},{-1.2,1.2,0}}\
]]

crate=WireFrame[Graphics3D[Cuboid[{1,1,0},{-1,-1,5}]]]

Show[wavefunction,xaxis,uaxis,vaxis,plane,repsi,impsi,end,crate]
文件历史
点击某个日期/时间查看对应时刻的文件。
| 日期/时间 | 缩略图 | 大小 | 用户 | 备注 | |
|---|---|---|---|---|---|
| 当前 | 2014年5月3日 (六) 13:29 | 250 × 625(11 KB) | 老陳(留言 | 贡献) | Add near side edges of the top square. | |
| 2007年6月2日 (六) 21:02 | 250 × 625(11 KB) | Inductiveload(留言 | 贡献) | {{Information |Description=Diagram of elliptical polarisation |Source=Own drawing down in Mathematica, edited in Inkscape. |Date=12/02/07 |Author=User:Inductiveload |Permission={{PD-self}} |other_versions=[[:image:Polarisation (Circular).svg|Circular |
您不可以覆盖此文件。
文件用途
全域文件用途
以下其他wiki使用此文件:
- bs.wikipedia.org上的用途
- de.wikipedia.org上的用途
- en.wikipedia.org上的用途
- es.wikipedia.org上的用途
- et.wikipedia.org上的用途
- fr.wikipedia.org上的用途
- fr.wikiversity.org上的用途
- he.wikipedia.org上的用途
- ko.wikipedia.org上的用途
- mk.wikipedia.org上的用途
- no.wikipedia.org上的用途
- ru.wikipedia.org上的用途
- sh.wikipedia.org上的用途
- tr.wikipedia.org上的用途
- uk.wikipedia.org上的用途
- vi.wikipedia.org上的用途
- zh.wikipedia.org上的用途
.svg&oldid=467942344)