Geographic diagram
Jump to navigation
Jump to search

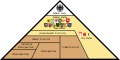
A geographic diagram is a diagram in the field of geography, the field of science devoted to the study of the lands, the features, the inhabitants, and the phenomena of Earth.
History
[edit]- 18th century
-
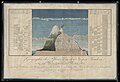
 Table of Geography and Hydrography, Cyclopaedia, 1728
 -
 Products map of Europe by August Crome, 1782:
 -
 Map with the sizes of European countries by August Crome, 1785.


- 19th century
-
 Geography of plants by Alexander von Humboldt, 1805.
 -
 Thomson Map of the Comparative Heights of the World's Great Mountains, 1817
 -
 Darton and Gardner Comparative Chart of World Mountains and Rivers, 1823
 -
 Comparative Chart of the Area and Population, 1833
 -
 Choropleth map by Charles Dupin, 1834
 -
 Statistique de la Population Francaise by Adolphe d'Angeville, 1836
 -
 Population dot map, 1830
 -
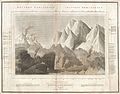
 Tallis Maps of the Mountains, Rivers, Waterfalls, 1850
 -
 Maury plate, 1855
 -
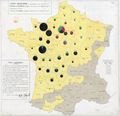 Minard's map of cattle sent from all around France for consumption in Paris (1858).
 -
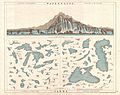 Mackenzie Map of Waterfalls and Lakes, 1860
 -
 Johnson Diagram of the World Time Zones, 1862
 -
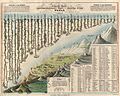
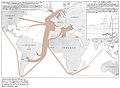 Minard’s map of French wine exports for 1864
 -
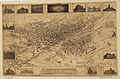
 Old map of Galveston, 1871
 -
 Map of Denver, Colorado, USA in 1881
 -
 Map with population density in Germany, 1881
 -
 Map of Population density in German Empire, 1892
 -
 passages des Pyrénées, 1894


_-_Geographicus_-_MtsRvrsWest-tlls-1850.jpg)


- 20th century
-
 Geographical reconnaissance, 1916
 -
 Story of geographical discovery by Jacobs, 1916
 -
 Map indicating population density, 1922
 -
 Sioux City AAB Diagram, 1944
 -
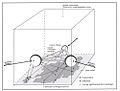 Bulbs Cube diagram by Hoekveld, 1965-70
 -
 Enkhuizen model web by Adri Dietvorst, 1994
 -
 Transformatiemodel by Adri Dietvorst, 1995
 -
 Transformation-based view of GIS operation, 1995
_(14782623275).jpg)
.png)
_(14760804414).jpg)


- 21st century
-
 Geoservices server with apps
 -
 Big city connected data
 -
 Concept map of population growth, 2014


Types of geographic diagrams
[edit]Comparison charts
[edit]-
Map with the sizes of European countries by August Crome, 1785.
-
 Comparison diagram mountains
 -
 Comparison diagram lakes


-
 Cartographic properties
 -
Concept map of population growth
-
 Grund das eins funktionen
 -
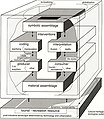
 GBH-GIS meta architecture
 -
 Mosaic 20model of coevolution


-
 Circular flow diagrams
 -
 Development of a cartographic method
 -
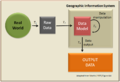
 Flow of GIS data
 -
Flow maps
-
 GISc lex
 -
 Gis model voorbeeld totstandkoming
 -
 Van concept naar fysiek model


Functional diagrams
[edit]-
 Geographischer Formenwandel
 -
Geoservices server with apps
-
 Policy Analysis Evaluation
 -
 Sahel syndrom
 -
 Spatial Contextual Awareness
 -
Transformation-based view of GIS operation, 1995


Layered diagrams
[edit]


-
 Administrative divisions of Germany
 -
 Organización Colombia


Thematic maps
[edit]-
Choropleth map by Charles Dupin, 1834
-
Flow map of French wine exports for 1864
-
Population dot map, 1830
-
Products map of Europe by August Crome, 1782:
-
Statistical map of population of France by Adolphe d'Angeville, 1836
-
 Basque country
 -
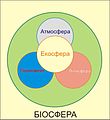 Biosphere
 -
 British Isles
 -
 Core frame
 -
 Eco structure
 -
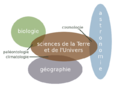 Geographical sciences
 -
 Renta de ubicación
 -
 Von Thunen model


.png)


Themes of geographic diagrams
[edit]Diagrams of lakes
[edit]-
Comparison chart of Waterfalls and Lakes
-
 Infographic expansion of water Summer Winter
 -
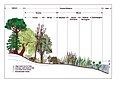 Profile Wetland for Great Lakes


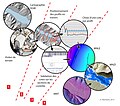
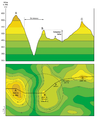
Diagrams of mountains
[edit]- General
-
 Block diagram
 -
Comparison diagram
-
 Cross section
 -
 Drawing
 -
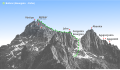 Picture, illustrated
 -
 Profile


- Diagrams of altitudinal zones


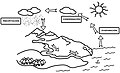
Diagrams of volcanoes
[edit]-
 block diagram
 -
Comparison diagram
-
 Cross section
 -
 Cross section of landscape
 -
 Dynamics


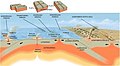
Geographic coordinate system
[edit]


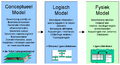
Geographical models
[edit]-
Bulbs Cube diagram by Hoekveld, 1965-70
-
 Burgess model
 -
Enkhuizen model web by Adri Dietvorst, 1994
-
Transformatiemodel by Adri Dietvorst, 1995
Horizon diagrams
[edit]-
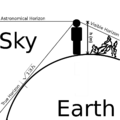 Three horizons
 -
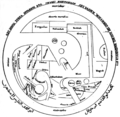
 Astronomical, true, and visible horizon
 -
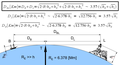 Horizon distance


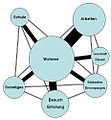
Population diagrams
[edit]-
Comparative Chart of the Area and Population, 1833
-
Concept map of population growth
-
 Line chart of population of Greece since 1961

Time zone diagrams
[edit]-
Johnson Diagram of the World Time Zones, 1862