File:Gradient descent.svg
Bước tới điều hướng
Bước tới tìm kiếm

Kích thước bản xem trước PNG này của tập tin SVG: 512×549 điểm ảnh. Độ phân giải khác: 224×240 điểm ảnh | 448×480 điểm ảnh | 716×768 điểm ảnh | 955×1.024 điểm ảnh | 1.910×2.048 điểm ảnh.
Tập tin gốc (tập tin SVG, 512×549 điểm ảnh trên danh nghĩa, kích thước: 56 kB)
Chú thích
Chú thích
Ghi một dòng giải thích những gì có trong tập tin này
Miêu tả
[sửa]
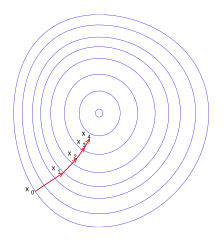
| Miêu tả | An illustration of the gradient descent method. I graphed this with Matlab |
| Ngày | (UTC) |
| Nguồn gốc |
Là ảnh phái sinh từ: Gradient descent.png:  |
| Tác giả |
|
| Đây là một ảnh đã được chỉnh sửa, có nghĩa là nó đã được chỉnh sửa kỹ thuật số so với phiên bản gốc. Các chỉnh sửa: Vector version. Có thể xem phiên bản gốc tại đây: Gradient descent.png. Các chỉnh sửa được thực hiện bởi Zerodamage.
|
Giấy phép
[sửa]
Tôi, người giữ bản quyền tác phẩm này, từ đây phát hành nó theo giấy phép sau:
| Tôi, người giữ bản quyền của tác phẩm này, chuyển tác phẩm này vào phạm vi công cộng. Điều này có giá trị trên toàn thế giới. Tại một quốc gia mà luật pháp không cho phép điều này, thì: Tôi cho phép tất cả mọi người được quyền sử dụng tác phẩm này với bất cứ mục đích nào, không kèm theo bất kỳ điều kiện nào, trừ phi luật pháp yêu cầu những điều kiện đó. |
Source code
[sửa]
% Illustration of gradient descent
function main()

% the ploting window
   figure(1);
   clf; hold on;
   set(gcf, 'color', 'white');
   set(gcf, 'InvertHardCopy', 'off');
   axis equal; axis off;

% the box
   Lx1=-2; Lx2=2; Ly1=-2; Ly2=2;

% the function whose contours will be plotted
   N=60; h=1/N;
   XX=Lx1:h:Lx2;
   YY=Ly1:h:Ly2;
   [X, Y]=meshgrid(XX, YY);
   f=inline('-((y+1).^4/25+(x-1).^4/10+x.^2+y.^2-1)');
   Z=f(X, Y);

% the contours
   h=0.3; l0=-1; l1=20;
   l0=h*floor(l0/h);
   l1=h*floor(l1/h);
   v=[l0:1.5*h:0 0:h:l1 0.8 0.888];
   [c,h] = contour(X, Y, Z, v, 'b');

% graphing settings
   small=0.08;
   small_rad = 0.01;
   thickness=1; arrowsize=0.06; arrow_type=2;
   fontsize=13;
   red = [1, 0, 0];
   white = 0.99*[1, 1, 1];

% initial guess for gradient descent
   x=-0.6498; y=-1.0212;

   % run several iterations of gradient descent
   for i=0:4
      H=text(x-1.5*small, y+small/2, sprintf('x_%d', i));
      set(H, 'fontsize', fontsize, 'color', 0*[1 1 1]);

     % the derivatives in x and in y, the step size
      u=-2/5*(x-1)^3-2*x;
      v=-4/25*(y+1)^3-2*y;
      alpha=0.11;

      if i< 4
         plot([x, x+alpha*u], [y, y+alpha*v]);
         arrow([x, y], [x, y]+alpha*[u, v], thickness, arrowsize, pi/8, ...
               arrow_type, [1, 0, 0])
         x=x+alpha*u; y=y+alpha*v;
      end

   end

% some dummy text, to expand the saving window a bit
   text(-0.9721, -1.5101, '*', 'color', white);
   text(1.5235,   1.1824, '*', 'color', white);

% save to eps
   saveas(gcf, 'Gradient_descent.eps', 'psc2')

function arrow(start, stop, thickness, arrow_size, sharpness, arrow_type, color)

% Function arguments:
% start, stop:  start and end coordinates of arrow, vectors of size 2
% thickness:    thickness of arrow stick
% arrow_size:   the size of the two sides of the angle in this picture ->
% sharpness:    angle between the arrow stick and arrow side, in radians
% arrow_type:   1 for filled arrow, otherwise the arrow will be just two segments
% color:        arrow color, a vector of length three with values in [0, 1]

% convert to complex numbers
   i=sqrt(-1);
   start=start(1)+i*start(2); stop=stop(1)+i*stop(2);
   rotate_angle=exp(i*sharpness);

% points making up the arrow tip (besides the "stop" point)
   point1 = stop - (arrow_size*rotate_angle)*(stop-start)/abs(stop-start);
   point2 = stop - (arrow_size/rotate_angle)*(stop-start)/abs(stop-start);

   if arrow_type==1 % filled arrow

% plot the stick, but not till the end, looks bad
      t=0.5*arrow_size*cos(sharpness)/abs(stop-start); stop1=t*start+(1-t)*stop;
      plot(real([start, stop1]), imag([start, stop1]), 'LineWidth', thickness, 'Color', color);

% fill the arrow
      H=fill(real([stop, point1, point2]), imag([stop, point1, point2]), color);
      set(H, 'EdgeColor', 'none')

   else % two-segment arrow
      plot(real([start, stop]), imag([start, stop]),   'LineWidth', thickness, 'Color', color);
      plot(real([stop, point1]), imag([stop, point1]), 'LineWidth', thickness, 'Color', color);
      plot(real([stop, point2]), imag([stop, point2]), 'LineWidth', thickness, 'Color', color);
   end

function ball(x, y, r, color)
   Theta=0:0.1:2*pi;
   X=r*cos(Theta)+x;
   Y=r*sin(Theta)+y;
   H=fill(X, Y, color);
   set(H, 'EdgeColor', 'none');

%plot2svg must be retrieved from http://www.zhinst.com/blogs/schwizer/
plot2svg;
Nhật trình tải lên đầu tiên
[sửa]
This image is a derivative work of the following images:
- File:Gradient_descent.png licensed with PD-self
- 2007-06-23T03:33:09Z Oleg Alexandrov 482x529 (25564 Bytes) {{Information |Description=An illustration of the gradient descent method. I graphed this with Matlab |Source=Originally from [http://en.wikipedia.org en.wikipedia]; description page is/was [http://en.wikipedia.org/w/index.ph
Uploaded with derivativeFX
Lịch sử tập tin
Nhấn vào ngày/giờ để xem nội dung tập tin tại thời điểm đó.
| Ngày/Giờ | Hình xem trước | Kích cỡ | Thành viên | Miêu tả | |
|---|---|---|---|---|---|
| hiện tại | 19:04, ngày 7 tháng 8 năm 2012 | | 512×549 (56 kB) | Zerodamage (thảo luận | đóng góp) | == {{int:filedesc}} == {{Information |Description=An illustration of the gradient descent method. I graphed this with Matlab |Source={{Derived from|Gradient_descent.png|display=50}} |Date=2012-08-07 19:02 (UTC) |Author=*File:Gradient_descent.png:... |
Bạn không được phép ghi đè tập tin này.
Trang sử dụng tập tin
Trang sau sử dụng tập tin này:
Sử dụng tập tin toàn cục
Những wiki sau đang sử dụng tập tin này:
- Trang sử dụng tại ar.wikipedia.org
- Trang sử dụng tại ca.wikipedia.org
- Trang sử dụng tại cs.wikipedia.org
- Trang sử dụng tại de.wikiversity.org
- Trang sử dụng tại en.wikipedia.org
- Trang sử dụng tại en.wikiversity.org
- Trang sử dụng tại he.wikipedia.org
- Trang sử dụng tại it.wikipedia.org
- Trang sử dụng tại pt.wikipedia.org
- Trang sử dụng tại sr.wikipedia.org
- Trang sử dụng tại uk.wikipedia.org
- Trang sử dụng tại vi.wikipedia.org
- Trang sử dụng tại zh-yue.wikipedia.org