Category:2011 maps of Europe
Jump to navigation
Jump to search
Temperate regions: North America · South America · Africa · Europe · Asia · Oceania – Polar regions: – Other regions:
English: 2011 maps of Europe
Español: Mapas de Europa en 2011
Suomi: Euroopan kartat vuodelta 2011
Română: Hărți ale Europei din 2011
Subcategories
This category has the following 15 subcategories, out of 15 total.
B
- 2011 maps of Bulgaria (11 F)
C
- 2011 maps of Croatia (3 F)
D
- 2011 maps of Denmark (1 F)
E
G
- 2011 maps of Greece (2 F)
I
- 2011 maps of Italy (4 F)
R
- 2011 maps of Romania (40 F)
- 2011 maps of Russia (8 F)
S
T
- Tour de France maps 2011 (3 F)
U
- 2011 maps of Ukraine (2 F)
- 2011 maps of the United Kingdom (19 F)
Media in category "2011 maps of Europe"
The following 54 files are in this category, out of 54 total.
-
 2011 UEFA Women's Under-17 Championship map.svg 610 × 457; 366 KB
-
 British Isles population density 2011 countries.svg 871 × 1,346; 1.89 MB
-
 Bulgaria ethnic map.png 1,600 × 1,282; 102 KB
-
 Bulgaria languages.svg 1,525 × 1,000; 326 KB
-
 C 2011.png 615 × 355; 24 KB
-
 Carte des paroisses fiscales en 1300 - ALPAGE.svg 503 × 569; 1.06 MB
-
 Croatia-Ethnic-2011.png 2,201 × 2,151; 266 KB
-
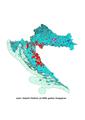
 Croatia-italian-language-2011 pop.PNG 2,080 × 2,064; 247 KB
-
 Croatia-Serbs-2011.PNG 2,201 × 2,151; 280 KB
-
 Croats in eastern Croatia.jpg 1,176 × 740; 75 KB
-
 Croats in Osijek-Baranja County.jpg 739 × 478; 48 KB
-
 Croats in Vukovar-Syrmia County.jpg 757 × 490; 42 KB
-
 Death-rate-from-opioid-use-who,Europe,2011.svg 850 × 600; 152 KB
-
 Death-rate-smoking,Europe,2011.svg 850 × 699; 153 KB
-
 Deutsch-Français.png 1,218 × 1,245; 71 KB
-
 EU Regional Policy, 2007.svg 609 × 600; 2.18 MB
-
 Eurogipsy.svg 2,044 × 1,719; 574 KB
-
 European countries by forest cover.jpg 3,891 × 3,160; 4.49 MB
-
 Europäische Wirtschafts- und Währungsunion-2011.svg 680 × 520; 519 KB
-
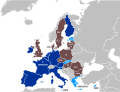 Eurozone map-2011.svg 680 × 520; 538 KB
-
 Hrvatska 2011.pdf 1,239 × 1,754; 12.91 MB
-
 Hungarian counties by proportion of minority residents.svg 1,052 × 744; 167 KB
-
 Hungarians in eastern Croatia.jpg 1,080 × 596; 120 KB
-
 Islam in Europe-2011.svg 841 × 732; 354 KB
-
 Karte Bruchsal Stadtteile.png 2,076 × 2,390; 271 KB
-
 Kriminalita2011.PNG 1,053 × 624; 70 KB
-
 M 2011.png 615 × 355; 23 KB
-
 Moravané 2011.png 615 × 355; 25 KB
-
 Najčešća prezimena po županijama (2011).png 1,690 × 979; 135 KB
-
 National minorities in Hungary.PNG 635 × 324; 39 KB
-
 Pagan-CR-(absolute).png 1,000 × 575; 21 KB
-
 Pagan-CR-(percent).png 1,000 × 575; 21 KB
-
 Pétrole et gaz - UE - Europe.svg 2,120 × 1,648; 706 KB
-
 Right-wing populist parties in European national parliaments.svg 680 × 520; 529 KB
-
 Savoie - Naissances par cantons 2011.png 4,712 × 3,864; 273 KB
-
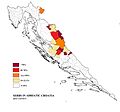 Serbs in adriatic Croatia.jpg 1,853 × 1,735; 234 KB
-
 Serbs in central Croatia.jpg 1,394 × 858; 128 KB
-
 Serbs in Croatia.jpg 2,201 × 2,151; 418 KB
-
 Serbs in Dalmatia.jpg 1,588 × 1,100; 149 KB
-
 Serbs in eastern Croatia.jpg 777 × 590; 59 KB
-
 Serbs in Karlovac County.jpg 744 × 557; 49 KB
-
 Serbs in Lika-Senj County.jpg 744 × 557; 44 KB
-
 Serbs in Panonnian Croatia.jpg 1,752 × 920; 190 KB
-
 Serbs in Sisak-Moslavina County.jpg 859 × 557; 54 KB
-
 Serbs in Slavonia.jpg 1,072 × 590; 121 KB
-
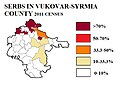 Serbs in Vukovar-Syrmia County.jpg 606 × 436; 37 KB
-
 Serbs in Zadar County.jpg 789 × 465; 55 KB
-
 Serbs in Šibenik-Knin County.jpg 712 × 465; 47 KB
-
 Serbs of Croatia 2011.jpg 740 × 724; 61 KB
-
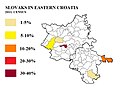 Slovaks of eastern Croatia 2011.jpg 866 × 674; 65 KB
-
 UNFICYP map may 2011.jpg 2,551 × 1,974; 908 KB
-
 Věřící - sčítání 2011.png 615 × 355; 25 KB
-
 Словацкий-язык-в-Венгрии.png 1,100 × 720; 344 KB
-
 Словацкий-язык-в-Чехии.png 1,000 × 781; 350 KB


.png)

.png)
.png)


