Category:2018 maps of Asia
Appearance
Temperate regions: North America · South America · Africa · Europe · Asia · Oceania – Polar regions: – Other regions:
English: 2018 maps of Asia
Español: Mapas de Asia en 2018
Subcategories
This category has the following 8 subcategories, out of 8 total.
A
- 2018 maps of Armenia (2 F)
C
- 2018 maps of China (13 F)
I
- 2018 maps of India (15 F)
- 2018 maps of Indonesia (20 F)
- 2018 maps of Iran (3 F)
P
R
- 2018 maps of Russia (3 F)
S
Media in category "2018 maps of Asia"
The following 200 files are in this category, out of 602 total.
(previous page) (next page)-
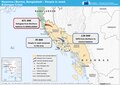
20180306 Myanmar Bangladesh Rohingya Crisis.pdf 1,754 × 1,239; 528 KB
-
20180306 Myanmar Bangladesh Rohingya Crisis.png 1,123 × 794; 612 KB
-
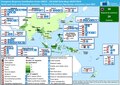
20180704 DailyMap Asia UCPMactivations.pdf 1,754 × 1,239; 668 KB
-
Absolute change co2, Asia, 2018.svg 850 × 600; 151 KB
-
Absolute number of deaths from household air pollution, Asia, 2018.svg 850 × 677; 152 KB
-
Absolute number of deaths from outdoor air pollution, Asia, 2018.svg 850 × 677; 151 KB
-
Access to clean fuels and technologies for cooking, Asia, 2018.svg 850 × 721; 153 KB
-
Affordability cigarettes, Asia, 2018.svg 850 × 600; 147 KB
-
Age of electoral democracy, Asia, 2018.svg 850 × 922; 153 KB
-
Age of liberal democracy row, Asia, 2018.svg 850 × 922; 153 KB
-
Age standardized deaths from all causes, Asia, 2018.svg 850 × 677; 150 KB
-
Agriculture share gdp, Asia, 2018.svg 850 × 600; 151 KB
-
Air passenger kilometers, Asia, 2018.svg 850 × 600; 148 KB
-
Air passengers carried, Asia, 2018.svg 850 × 600; 149 KB
-
Air pollution deaths country, Asia, 2018.svg 850 × 600; 150 KB
-
Air transport freight ton km, Asia, 2018.svg 850 × 600; 149 KB
-
Air trips per capita, Asia, 2018.svg 850 × 600; 152 KB
-
Alcohol disorders dalys age standardized rate, Asia, 2018.svg 850 × 600; 147 KB
-
Alcohol drug use disorders share total disease, Asia, 2018.svg 850 × 677; 149 KB
-
Annual co2 cement, Asia, 2018.svg 850 × 600; 150 KB
-
Annual co2 coal, Asia, 2018.svg 850 × 600; 152 KB
-
Annual co2 emissions per country, Asia, 2018.svg 850 × 878; 154 KB
-
Annual co2 flaring, Asia, 2018.svg 850 × 600; 150 KB
-
Annual co2 gas, Asia, 2018.svg 850 × 600; 151 KB
-
Annual co2 oil, Asia, 2018.svg 850 × 600; 150 KB
-
Annual co2 other industry, Asia, 2018.svg 850 × 600; 151 KB
-
Annual healthcare expenditure per capita, Asia, 2018.svg 850 × 736; 157 KB
-
Annual share of co2 emissions, Asia, 2018.svg 850 × 878; 153 KB
-
Annual-healthcare-expenditure-per-capita,Asia,2018.svg 850 × 736; 157 KB
-
Antibiotic consumption rate, Asia, 2018.svg 850 × 721; 153 KB
-
Antibiotic usage in children, Asia, 2018.svg 850 × 600; 149 KB
-
Antidepressants per capita, Asia, 2018.svg 850 × 600; 149 KB
-
Anxiety disorders prevalence, Asia, 2018.svg 850 × 691; 148 KB
-
Apple production, Asia, 2018.svg 850 × 600; 155 KB
-
Armed forces personnel of total labor force, Asia, 2018.svg 850 × 600; 153 KB
-
Armed forces personnel percent, Asia, 2018.svg 850 × 600; 153 KB
-
Art coverage for pregnant women, Asia, 2018.svg 850 × 600; 150 KB
-
Asia WorldRugby federations by number of registered players (2018).svg 821 × 572; 1.14 MB
-
Asthma prevalence, Asia, 2018.svg 850 × 677; 148 KB
-
Autopsy rate, Asia, 2018.svg 850 × 600; 149 KB
-
Average exposure pm25 pollution, Asia, 2018.svg 850 × 825; 152 KB
-
Average non hdl cholesterol levels, Asia, 2018.svg 850 × 998; 154 KB
-
Avocado production, Asia, 2018.svg 850 × 600; 155 KB
-
Banana production, Asia, 2018.svg 850 × 600; 155 KB
-
Bangladesh BG routes and border crossings.png 2,833 × 3,830; 2.06 MB
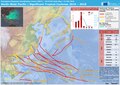
-
Barley production, Asia, 2018.svg 850 × 600; 155 KB
-
Barley yields, Asia, 2018.svg 850 × 600; 150 KB
-
Bcg immunization coverage for tb among 1 year olds, Asia, 2018.svg 850 × 729; 150 KB
-
Bean production, Asia, 2018.svg 850 × 600; 155 KB
-
Beef and buffalo meat production tonnes, Asia, 2018.svg 850 × 600; 152 KB
-
Beer consumption per person, Asia, 2018.svg 850 × 600; 149 KB
-
Bipolar disorder prevalence, Asia, 2018.svg 850 × 691; 148 KB
-
Births attended by health staff sdgs, Asia, 2018.svg 850 × 600; 148 KB
-
Burden of disease rates from injuries, Asia, 2018.svg 850 × 600; 150 KB
-
Burden of disease rates from ncds, Asia, 2018.svg 850 × 600; 151 KB
-
Burden of disease, Asia, 2018.svg 850 × 677; 151 KB
-
Cancer death rate who mdb, Asia, 2018.svg 850 × 826; 151 KB
-
Cancer incidence, Asia, 2018.svg 850 × 811; 150 KB
-
Cancer-death-rates,Asia,2018.svg 850 × 744; 155 KB
-
Carbon intensity electricity, Asia, 2018.svg 850 × 878; 157 KB
-
Cardiovascular-disease-death-rates,Asia,2018.svg 850 × 744; 155 KB
-
Cases of extensively drug resistant tuberculosis, Asia, 2018.svg 850 × 915; 152 KB
-
Cases of multidrug resistant tuberculosis, Asia, 2018.svg 850 × 795; 151 KB
-
Cases of paralytic polio from vaccine derived viruses, Asia, 2018.svg 850 × 781; 150 KB
-
Cases of paralytic polio from wild polioviruses, Asia, 2018.svg 850 × 721; 150 KB
-
Cashew nut production, Asia, 2018.svg 850 × 600; 155 KB
-
Cassava production, Asia, 2018.svg 850 × 600; 155 KB
-
Cattle meat yields hectograms 100 grams per animal, Asia, 2018.svg 850 × 600; 151 KB
-
Cereal production, Asia, 2018.svg 850 × 600; 154 KB
-
Cervical cancer death rate in women, Asia, 2018.svg 850 × 826; 152 KB
-
Change co2 annual pct, Asia, 2018.svg 850 × 878; 153 KB
-
Chicken meat production, Asia, 2018.svg 850 × 600; 154 KB
-
Child adolescent obesity, Asia, 2018.svg 850 × 600; 148 KB
-
Child deaths from invasive non typhoidal salmonella, Asia, 2018.svg 850 × 677; 149 KB
-
Child deaths from malaria number, Asia, 2018.svg 850 × 600; 147 KB
-
Child deaths from malaria, Asia, 2018.svg 850 × 600; 149 KB
-
Child mortality around the world, Asia, 2018.svg 850 × 600; 148 KB
-
Child mortality, Asia, 2018.svg 850 × 600; 151 KB
-
Children living with hiv, Asia, 2018.svg 850 × 600; 150 KB
-
Children sleeping under treated bednet, Asia, 2018.svg 850 × 600; 150 KB
-
Children who are overweight sdgs, Asia, 2018.svg 850 × 600; 148 KB
-
Children who receive ors, Asia, 2018.svg 850 × 677; 151 KB
-
Co emissions per capita, Asia, 2018.svg 850 × 878; 154 KB
-
Co2 emissions transport, Asia, 2018.svg 850 × 600; 148 KB
-
Coal consumption per capita, Asia, 2018.svg 850 × 736; 156 KB
-
Coal energy share, Asia, 2018.svg 850 × 818; 157 KB
-
Cobalt production, Asia, 2018.svg 850 × 600; 148 KB
-
Cocoa bean production, Asia, 2018.svg 850 × 600; 155 KB
-
Coffee bean production, Asia, 2018.svg 850 × 600; 156 KB
-
Colon and rectum cancer death rate, Asia, 2018.svg 850 × 826; 151 KB
-
Condom use at last high risk sex, Asia, 2018.svg 850 × 600; 149 KB
-
Cost healthy diet, Asia, 2018.svg 850 × 736; 153 KB
-
Countries-with-national-cervical-cancer-screening-program,Asia,2018.svg 850 × 600; 147 KB
-
Coverage of the human papillomavirus vaccine, Asia, 2018.svg 850 × 706; 151 KB
-
Cross country literacy rates, Asia, 2018.svg 850 × 600; 153 KB
-
Crude birth rate, Asia, 2018.svg 850 × 600; 154 KB
-
Crude death rate hmd, Asia, 2018.svg 850 × 721; 152 KB
-
Crude death rate, Asia, 2018.svg 850 × 600; 146 KB
-
Cumulative co emissions from other industry, Asia, 2018.svg 850 × 600; 151 KB
-
Cumulative co emissions, Asia, 2018.svg 850 × 878; 153 KB
-
Cumulative co2 cement, Asia, 2018.svg 850 × 600; 150 KB
-
Cumulative co2 coal, Asia, 2018.svg 850 × 600; 152 KB
-
Cumulative co2 flaring, Asia, 2018.svg 850 × 600; 150 KB
-
Cumulative co2 gas, Asia, 2018.svg 850 × 600; 151 KB
-
Cumulative co2 oil, Asia, 2018.svg 850 × 600; 150 KB
-
Daily mean income, Asia, 2018.svg 850 × 774; 153 KB
-
Daily meat consumption per person, Asia, 2018.svg 850 × 600; 150 KB
-
Daily median income, Asia, 2018.svg 850 × 774; 154 KB
-
Daily per capita caloric supply, Asia, 2018.svg 850 × 600; 152 KB
-
Daily-per-capita-protein-supply,Asia,2018.svg 850 × 600; 155 KB
-
Dalys particulate matter, Asia, 2018.svg 850 × 729; 153 KB
-
Dalys-rate-from-all-causes,Asia,2018.svg 850 × 677; 156 KB
-
Death rate amphetamine who, Asia, 2018.svg 850 × 600; 148 KB
-
Death rate from air pollution per 100000, Asia, 2018.svg 850 × 600; 150 KB
-
Death rate from alzheimers other dementias gbd, Asia, 2018.svg 850 × 691; 149 KB
-
Death rate from cancer gbd, Asia, 2018.svg 850 × 789; 150 KB
-
Death rate from cancer, Asia, 2018.svg 850 × 789; 150 KB
-
Death rate from diabetes gbd, Asia, 2018.svg 850 × 795; 149 KB
-
Death rate from diabetes, Asia, 2018.svg 850 × 848; 150 KB
-
Death rate from diarrheal diseases, Asia, 2018.svg 850 × 691; 149 KB
-
Death rate from digestive diseases gbd, Asia, 2018.svg 850 × 691; 155 KB
-
Death rate from drowning ghe, Asia, 2018.svg 850 × 600; 154 KB
-
Death rate from falls gbd rate, Asia, 2018.svg 850 × 600; 147 KB
-
Death rate from fires and burns ihme, Asia, 2018.svg 850 × 600; 147 KB
-
Death rate from fires and burns who, Asia, 2018.svg 850 × 600; 154 KB
-
Death rate from hivaids who, Asia, 2018.svg 850 × 677; 149 KB
-
Death rate from hivaids, Asia, 2018.svg 850 × 677; 149 KB
-
Death rate from malaria ghe, Asia, 2018.svg 850 × 706; 149 KB
-
Death rate from malaria ihme, Asia, 2018.svg 850 × 706; 148 KB
-
Death rate from malaria, Asia, 2018.svg 850 × 706; 149 KB
-
Death rate from maternal disorders ihme, Asia, 2018.svg 850 × 818; 151 KB
-
Death rate from meningitis who, Asia, 2018.svg 850 × 600; 151 KB
-
Death rate from obesity gbd, Asia, 2018.svg 850 × 706; 149 KB
-
Death rate from obesity, Asia, 2018.svg 850 × 759; 159 KB
-
Death rate from ozone pollution gbd, Asia, 2018.svg 850 × 706; 151 KB
-
Death rate from ozone pollution, Asia, 2018.svg 850 × 759; 152 KB
-
Death rate from poisoning, Asia, 2018.svg 850 × 677; 154 KB
-
Death rate from road accidents, Asia, 2018.svg 850 × 600; 147 KB
-
Death rate from smoking, Asia, 2018.svg 850 × 662; 154 KB
-
Death rate from strokes who, Asia, 2018.svg 850 × 774; 149 KB
-
Death rate from suicides ghe, Asia, 2018.svg 850 × 600; 148 KB
-
Death rate from suicides gho, Asia, 2018.svg 850 × 677; 149 KB
-
Death rate from suicides, Asia, 2018.svg 850 × 600; 148 KB
-
Death rate from unsafe sanitation gbd, Asia, 2018.svg 850 × 677; 149 KB
-
Death rate from venomous animal, Asia, 2018.svg 850 × 677; 149 KB
-
Death rate lead exposure, Asia, 2018.svg 850 × 677; 148 KB
-
Death rate smoking, Asia, 2018.svg 850 × 714; 149 KB
-
Death rate typhoid paratyphoid fever children under 5, Asia, 2018.svg 850 × 714; 149 KB
-
Death rates cocaine who, Asia, 2018.svg 850 × 600; 148 KB
-
Death rates due to low physical activity, Asia, 2018.svg 850 × 744; 150 KB
-
Death rates from drug use, Asia, 2018.svg 850 × 714; 149 KB
-
Death rates from high blood pressure gbd, Asia, 2018.svg 850 × 736; 149 KB
-
Death rates from high blood pressure, Asia, 2018.svg 850 × 789; 156 KB
-
Death rates from no access to handwashing facilities, Asia, 2018.svg 850 × 714; 149 KB
-
Death rates from unsafe water sources gbd, Asia, 2018.svg 850 × 662; 148 KB
-
Death rates substance disorders who, Asia, 2018.svg 850 × 662; 154 KB
-
Death rates substance disorders, Asia, 2018.svg 850 × 714; 149 KB
-
Death-rate-by-source-from-indoor-air-pollution,Asia,2018.svg 850 × 729; 156 KB
-
Death-rate-from-opioid-use,Asia,2018.svg 850 × 677; 154 KB
-
Death-rate-from-opioid-use-who,Asia,2018.svg 850 × 600; 146 KB
-
Death-rate-from-suicides-ghe,Asia,2018.svg 850 × 600; 154 KB
-
Death-rate-smoking,Asia,2018.svg 850 × 699; 149 KB
-
Death-rates-cocaine,Asia,2018.svg 850 × 677; 154 KB
-
Deaths due to unsafe sex, Asia, 2018.svg 850 × 662; 148 KB
-
Deaths due to unsafe water sources, Asia, 2018.svg 850 × 662; 149 KB
-
Deaths from aids ihme, Asia, 2018.svg 850 × 677; 148 KB
-
Deaths from cancer gbd, Asia, 2018.svg 850 × 691; 148 KB
-
Deaths from cancer who, Asia, 2018.svg 850 × 691; 148 KB
-
Deaths from cardiovascular disease ghe, Asia, 2018.svg 850 × 691; 149 KB
-
Deaths from cysticercosis, Asia, 2018.svg 850 × 766; 149 KB
-
Deaths from diabetes ghe, Asia, 2018.svg 850 × 795; 149 KB
-
Deaths from diarrheal diseases, Asia, 2018.svg 850 × 691; 149 KB
-
Deaths from fires and burns, Asia, 2018.svg 850 × 600; 153 KB
-
Deaths from liver disease, Asia, 2018.svg 850 × 691; 148 KB
-
Deaths from malnutrition ghe, Asia, 2018.svg 850 × 600; 148 KB
-
Deaths from natural disasters, Asia, 2018.svg 850 × 600; 148 KB
-
Deaths from ozone pollution, Asia, 2018.svg 850 × 706; 151 KB
-
Deaths from parkinsons disease ghe, Asia, 2018.svg 850 × 721; 149 KB
-
Deaths from preterm birth complications, Asia, 2018.svg 850 × 714; 150 KB
-
Deaths from secondhand smoke, Asia, 2018.svg 850 × 662; 148 KB
-
Deaths from substance disorders who, Asia, 2018.svg 850 × 662; 149 KB
-
Deaths from substance disorders, Asia, 2018.svg 850 × 662; 149 KB
-
Deaths lead exposure, Asia, 2018.svg 850 × 600; 147 KB
-
Deaths registered with an ill defined cause of death, Asia, 2018.svg 850 × 706; 153 KB
-
Dementia death rates, Asia, 2018.svg 850 × 744; 149 KB
-
Democracy index polity, Asia, 2018.svg 850 × 677; 153 KB
-
Dengue fever deaths, Asia, 2018.svg 850 × 706; 149 KB
-
Dengue incidence, Asia, 2018.svg 850 × 706; 154 KB