Category:Biochemistry
Jump to navigation
Jump to search
- (en) Biochemistry
- (af) Biochemie
- (an) Bioquimica
- (ar) كيمياء حيوية
- (arz) بيوكيميا
- (ast) Bioquímica
- (bg) Биохимия
- (bn) প্রাণরসায়ন
- (bs) Biohemija
- (ca) Bioquímica
- (cs) Biochemie
- (cy) Biocemeg
- (da) Biokemi
- (de) Biochemie
- (el) Βιοχημεία
- (eo) Biokemio
- (es) Bioquímica
- (et) Biokeemia
- (eu) Biokimika
- (fa) زیستشیمی
- (fi) Biokemia
- (fo) Lívevnafrøði
- (fr) Biochimie
- (fur) Biochimiche
- (fy) Biogemy
- (gl) Bioquímica
- (he) ביוכימיה
- (hi) जैवरसायनिकी
- (hr) Biokemija
- (hu) Biokémia
- (id) Biokimia
- (io) Biokemio
- (is) Lífefnafræði
- (it) Biochimica
- (ja) 生化学
- (jv) Biokimia
- (kk) Биохимия
- (ko) 생화학
- (la) Biochemia
- (lb) Biochimie
- (lmo) Biuchimica
- (lt) Biochemija
- (lv) Bioķīmija
- (mk) Биохемија
- (ml) ജൈവരസതന്ത്രം
- (mn) Биохими
- (ms) Biokimia
- (my) ဇီဝဓာတု
- (nl) Biochemie
- (nn) Biokjemi
- (no) Biokjemi
- (nov) Biokemie
- (oc) Bioquimia
- (pl) Biochemia
- (ps) ژونکيميا
- (pt) Bioquímica
- (qu) Kawsay chaqllisinchi
- (ro) Biochimie
- (ru) Биохимия
- (sah) Биохимия
- (sh) Biohemija
- (simple) Biochemistry
- (sk) Biochémia
- (sl) Biokemija
- (sq) Biokimia
- (sr) Биохемија
- (su) Biokimia
- (sv) Biokemi
- (sw) Biokemia
- (ta) உயிர்வேதியியல்
- (th) ชีวเคมี
- (tl) Biyokimika
- (tr) Biyokimya
- (uk) Біохімія
- (ur) حیاتی کیمیاء
- (vi) Hóa sinh
- (war) Biyokemika
- (yi) ביאכעמיע
- (zh) 生物化学
- (zh-min-nan) Seng-hoà-ha̍k

| Category Biochemistry on sister projects: | |||||||||
|---|---|---|---|---|---|---|---|---|---|
Wiktionary |
Wikiversity |
Wikibooks | |||||||
study of chemical processes in living organisms  | |||||
| Upload media | |||||
| Pronunciation audio | |||||
|---|---|---|---|---|---|
| Instance of | |||||
| Subclass of | |||||
| Part of | |||||
| Different from | |||||
| |||||
Subcategories
This category has the following 60 subcategories, out of 60 total.
*
.
A
- Active biological transport (37 F)
- Annals of Applied Biology (55 F)
B
- Binding sites (204 F)
- Biomineralization (24 F)
C
- CHON (3 F)
D
E
F
- Fructolysis (6 F)
- Function-spacer-lipid construct (13 F)
G
H
I
L
- Lehrbuch der Biochemie (4 F)
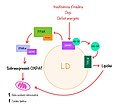
- Lipid droplets (83 F)
M
- Macromolecular complex analysis (41 F)
- Metabolic intermediates (1 F)
- Metabolomics (24 F)
N
O
- Organelle biogenesis (10 F)
P
- Pathobiochemistry (2 F)
R
S
W
Media in category "Biochemistry"
The following 200 files are in this category, out of 295 total.
(previous page) (next page)-
 1A1X A.png 300 × 300; 13 KB
-
 Acta Biochimica et Biophysica Sinica logo.svg 512 × 175; 12 KB
-
 Ada Yonath.jpg 1,024 × 683; 87 KB
-
 Adapt.jpg 417 × 231; 29 KB
-
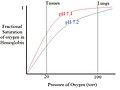
 Alleffects.jpg 1,000 × 1,000; 133 KB
-
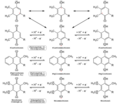
 Amino acid biosynthesis.svg 523 × 564; 100 KB
-
 Analysis of multiple transcription factor occupancy..jpg 445 × 285; 52 KB
-
 Anatomy of a bioreporter organism.jpg 458 × 164; 13 KB
-
 Apex2kaarel.jpg 2,395 × 2,071; 553 KB
-
 Aplicaciones del ARNtracr con el CRISPR.png 720 × 504; 69 KB
-
 Apobgene.JPG 605 × 534; 22 KB
-
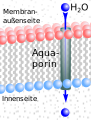
 Aquagliceroporines i malària.png 400 × 400; 26 KB
-
 Ascitic fluid analysis-Findings.jpg 3,264 × 2,448; 1.95 MB
-
 ATG14 - aminoácidos mutados y cáncer.png 558 × 525; 6 KB
-
 Atp i la rotenona.jpg 680 × 324; 91 KB
-
 Autonomous Pathogen Detection System.jpg 256 × 384; 27 KB
-
 Biochemistry Department, GSU.jpg 4,160 × 3,120; 4.25 MB
-
 Biodigestor.JPG 568 × 519; 46 KB
-
 Biogénesis de ARNtracr (Final).jpg 1,080 × 755; 349 KB
-
 Biogénesis de ARNtracr.png 1,080 × 755; 263 KB
-
 Biokeemia labori laud.JPG 5,472 × 3,648; 5.87 MB
-
 Biokemiakartta.svg 360 × 278; 18 KB
-
 Biologically important quinones de.png 1,200 × 1,050; 20 KB
-
 Biologically important quinones en.png 1,200 × 1,050; 20 KB
-
 Branch ccf.png 7,200 × 4,800; 175 KB
-
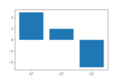
 BranchPointEffect.png 4,000 × 1,887; 311 KB
-
 Captura de pantalla 2013-10-13 a la(s) 12.43.40.png 596 × 237; 24 KB
-
 Capture d’écran 2015-10-18 à 11.22.00.png 889 × 577; 307 KB
-
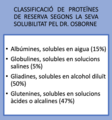 Classificació Osborne solubilitat.png 1,206 × 1,288; 190 KB
-
 CLEA.jpg 1,292 × 361; 41 KB
-
 CNNM3 protein scheme.png 1,231 × 305; 16 KB
-
 Cofactor Flow Chart.JPG 687 × 267; 21 KB
-
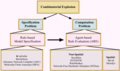
 Combinatorial BiologyPic.jpg 372 × 440; 37 KB
-
 Committed step.svg 744 × 354; 12 KB
-
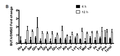 Concentrations of aa in inhibited-TPPII cells.png 636 × 297; 19 KB
-
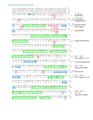
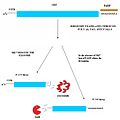
 Conceptual Translation of C22orf23.png 1,224 × 1,584; 150 KB
-
 Conceptual Translation with Secondary Structure.pdf 1,275 × 1,650, 2 pages; 105 KB
-
 Conceptual translation with the most important features.pdf 1,275 × 1,650, 2 pages; 656 KB
-
 ConnectivityTheoremDifferrentColor.png 4,000 × 1,829; 165 KB
-
 Conserved PTM map.tif 4,400 × 1,700; 28.53 MB
-
 Coop Dem.png 649 × 404; 18 KB
-

-
 Coulomb finalgr.jpg 787 × 390; 101 KB
-
 CPU time spent by each program when aligning increasing sequence lengths.png 1,250 × 564; 321 KB
-
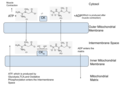 Creatine Phosphate Shuttle Diagram.png 1,270 × 920; 226 KB
-
 Cresta Localiza ATPsintasa.png 580 × 440; 126 KB
-
 Cresta Mitocondrial.png 1,123 × 794; 293 KB
-
 CSIRO ScienceImage 10486 Nutritional biochemistry.jpg 2,657 × 2,177; 3.49 MB
-
 Cèl·lules β TXNIP.jpg 586 × 504; 53 KB
-
 DCDStreamlines.tif 1,600 × 1,200; 5.49 MB
-
 DCDVelfield.tif 1,600 × 1,200; 5.49 MB
-
 Denpol-enzyme conjugate.png 1,134 × 593; 520 KB
-
 Department of biochemistry bayero University Kano.jpg 2,496 × 1,152; 1.04 MB
-
 Depiction of ACOT9 Protein.png 726 × 140; 15 KB
-
 Diagrama actividad de VGluT.tif 270 × 272; 28 KB
-
 Dimerization Portion of APOBEC1.png 950 × 466; 42 KB
-
 DisequilibriumRatioPlot.png 3,000 × 2,520; 219 KB
-
 DissequilibriumRatioPlot.svg 512 × 430; 16 KB
-
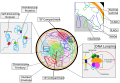
 Distribución de los metabolitos en el NP-Atlas.png 4,309 × 2,413; 1.51 MB
-
 Divergence of Sequence Identity (%) vs. Time (MYA) in ACOT9.png 389 × 265; 29 KB
-
 DL20231122 Aurora A inhibition MLN8237 VX689.tif 1,512 × 969; 206 KB
-
 DominancePlot.png 3,000 × 2,195; 254 KB
-
 Dos sustrates.png 588 × 213; 3 KB
-
 DrDennisBogdan-NationalAcademyOfClinicalBiochemistry-1978.jpg 2,863 × 2,184; 801 KB
-
 Dystonin, BPAG1, BP230.JPG 1,246 × 452; 68 KB
-
-
 EIF4A General Primary Structure.png 1,899 × 148; 9 KB
-
 ELISPOT.png 517 × 404; 39 KB
-
 Enterohepatic cycle bile acids.jpg 2,455 × 1,476; 2.08 MB
-
 Enzymatic Resolution.jpg 664 × 298; 37 KB
-
 Esquema creació cel b memoria.jpg 1,122 × 793; 184 KB
-
 Esquema familias de bacterias con sistema inmunológico CRISPR 2.pdf 1,120 × 1,652; 33 KB
-
 Estructura secundària UnaG.PNG 1,227 × 116; 6 KB
-
-
 Example IC50 curve demonstrating visually how IC50 is derived.png 669 × 624; 34 KB
-
 Exorf FLJ35894.png 1,232 × 761; 33 KB
-
 Expression of FAM167A.jpg 406 × 742; 124 KB
-
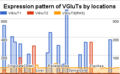 Expression pattern of VGluTs.png 343 × 212; 10 KB
-
 F-block elution sequence.png 417 × 533; 36 KB
-
 F. J. R. Hird and G. S. Sidhu 1957.jpg 425 × 335; 24 KB
-
 FAS 2.png 824 × 415; 126 KB
-
 FAS 3.png 2,136 × 1,168; 336 KB
-
 FFB - UNMSM.jpg 415 × 186; 66 KB
-
 Fig1fuaionfission.gif 854 × 663; 188 KB
-
 Figure 1 (7164414287).png 606 × 506; 592 KB
-
 Figure 1C (7046712585).png 746 × 581; 331 KB
-
 Figure 2 Model for the Synchronization of Liver Oscillators.png 2,780 × 1,671; 76 KB
-
 Figure 6 (6834735934).png 852 × 604; 746 KB
-
 Figure S1A (7312045718).png 717 × 716; 929 KB
-
 Figure S3A (colour inverted) (8007508031).png 790 × 718; 378 KB
-
 Fixacio complement.png 875 × 509; 321 KB
-
 Flavonoids Biochemistry.png 2,412 × 2,200; 332 KB
-
 Flumutant.png 512 × 768; 447 KB
-
 Folding Funnel.svg 167 × 255; 10 KB
-
 Foto wikipedia.pdf 1,241 × 1,754; 194 KB
-
 Foundation of medicine-min.jpg 468 × 329; 56 KB
-
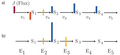
 Four Step Pathway.png 3,000 × 682; 128 KB
-
 Freqüència de distribució dels al·lels DQA1*0501 i DQB1*02.jpg 3,024 × 2,638; 1.56 MB
-
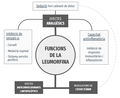 FUNCIONS LEUMORFINA.png 1,165 × 947; 84 KB
-
-
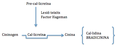
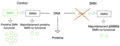
 Gen pro enzym.jpg 367 × 145; 5 KB
-
 Gen SMN1 i SMN2.jpg 1,560 × 622; 113 KB
-
 Gen SMN1 i SMN2.png 747 × 284; 51 KB
-
 General Overview of Protein Targeting.png 619 × 349; 75 KB
-
 GFLide signaalülekanne.png 650 × 446; 35 KB
-
 GFPT Comparison.png 737 × 271; 369 KB
-
 GluR-Schema.jpg 344 × 249; 15 KB
-
 Glypican, wnt, fgf.jpg 678 × 392; 64 KB
-
 Glypican.jpg 678 × 392; 54 KB
-
 GPATCH11 Structure.png 1,705 × 680; 61 KB
-
 Gripo viruso sandara.jpg 960 × 720; 76 KB
-
 GSNO figure.png 559 × 167; 80 KB
-
 GTP pkc2.jpg 1,280 × 720; 80 KB
-
 H-NS.jpg 563 × 462; 37 KB
-
 HBP 1.png 647 × 467; 57 KB
-
 Heme B.svg 512 × 595; 7 KB
-
 Hepcidine regulatie.jpg 960 × 720; 55 KB
-
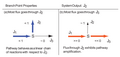
 HIF Nobel Prize Physiology Medicine 2019 Hegasy DE.png 3,508 × 2,480; 1.27 MB
-
 HIF Nobel Prize Physiology Medicine 2019 Hegasy ENG.png 3,508 × 2,480; 1.26 MB
-
 Horizontal-asw.svg 301 × 148; 867 KB
-
 Horizontal-large-asw.svg 904 × 478; 1.14 MB
-
 Hp53int1 Web Logo.png 745 × 424; 107 KB
-
 Human EST Profile CCDC132.png 295 × 633; 54 KB
-
 Hydropathy Plot of Eotaxin.jpg 2,500 × 1,547; 356 KB
-
 Immunofluorescència 2022-10-13 06 30 13.png 1,826 × 829; 970 KB
-
 Inhibició de l'ATGL.png 912 × 762; 67 KB
-
 Insertion.PNG 628 × 481; 105 KB
-
 Interaccions observades en la separació de fase per part de proteïnes.png 6,208 × 2,145; 18.39 MB
-
 Interaction of MUC16-CA125 and mesothelin.tiff 1,500 × 1,211; 5.22 MB
-
 Ionemotore.jpg 4,512 × 2,336; 615 KB
-
-
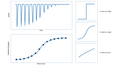 ITC thermogram.png 1,280 × 720; 54 KB
-
 ITC THERMOGRAM.png 1,280 × 720; 62 KB
-
 JHDK.svg 792 × 612; 694 KB
-
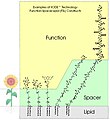 KODE Technology FSL constructs.JPG 876 × 958; 154 KB
-
 Kooperativitaet Biochem (Schema).png 680 × 397; 76 KB
-
 LacRepressor.png 679 × 147; 4 KB
-
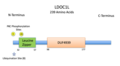 LDOC1L Protein Annotation.png 1,234 × 678; 82 KB
-
 Localización de la proteína MT5-MMP en la célula.png 383 × 378; 91 KB
-
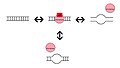 LocalstrandseparationRNA.jpg 886 × 501; 22 KB
-
 Lotus initiative 1 chemically interpreted biological tree.svg 1,314 × 1,338; 4.77 MB
-
 LPD and protein.jpg 813 × 592; 91 KB
-
 Macropinosomes form from cell surface paint.jpg 987 × 152; 12 KB
-
 MCAlogo.png 2,600 × 1,964; 131 KB
-
 Mecanime aines.jpg 4,000 × 3,000; 3.15 MB
-
 Mecanisme coxibs.jpg 4,000 × 3,000; 4.69 MB
-
 Mecanismeacció.png 712 × 471; 34 KB
-
 Mechanisms of eRNA function.png 979 × 713; 214 KB
-
 Mechanochemical Cell Biology Building.jpg 5,472 × 3,648; 8.34 MB
-
 Membranas mitocondriales.png 1,123 × 794; 139 KB
-
 Merozoite Surface Protein Pre and Post Invasion Diagram.jpg 835 × 960; 245 KB
-
 Metabolic pathways poster.pdf 1,875 × 2,850; 3.06 MB
-
 Metabolite repair.jpg 480 × 366; 73 KB
-
 MetaNetX-MNXref logo.png 1,076 × 640; 66 KB
-
 Methanol Dehydrogenase.jpg 640 × 355; 76 KB
-
 MFE or Isomerase.png 462 × 219; 31 KB
-
 MHC Binding Diagram.png 1,098 × 748; 66 KB
-
 Microscopic model of a nanoporous membrane.jpg 926 × 360; 30 KB
-
 MIF4GD Conceptual Translation for Wiki Article.jpg 970 × 1,211; 376 KB
-
 MinCDE System.svg 612 × 792; 140 KB
-
 Minor Spliceosome mechanism.png 599 × 511; 64 KB
-
 Mir-21-RNAfold.png 550 × 2,500; 194 KB
-

-
 Molecular regulation of cerebral cortex folding by Trnp1.jpg 2,274 × 2,941; 992 KB
-
 Morpheein dice.PNG 2,984 × 1,030; 812 KB
-
 Motivos dos barris TIM.tif 1,140 × 899; 630 KB
-
 MOTS-C.jpg 2,339 × 1,654; 212 KB
-
 MTE graph.jpg 522 × 389; 21 KB
-
 Mucoadhesion interpenetration fixed.png 736 × 227; 30 KB
-
 Multi state methods.tiff 4,341 × 2,558; 861 KB
-
 Mécanismes de régulation du cycle cellulaire.pdf 1,239 × 1,754; 240 KB
-
 N-DRC 1.png 529 × 479; 127 KB
-
 N-linked protein glycosylation in the ER.svg 2,662 × 1,018; 164 KB
-
 NCBI GEO Human Tissue Expression Profile for C20orf196.png 943 × 461; 84 KB
-
 Nef and Vpu protein interaction sites with the anti-viral tetherin protein.png 1,106 × 602; 154 KB
-
 Nichtkompetitiver Antagonist.png 422 × 256; 4 KB
-
 Nonstopdecay.jpg 658 × 656; 32 KB
-
 Nuclear Architecture.svg 835 × 576; 73 KB
-
 NucOxc.jpg 841 × 418; 87 KB
-
 Origin of Life.jpg 835 × 772; 151 KB
-
 Osmose-asw1.svg 147 × 194; 779 KB
-
 Oxidació lipídica regulada per OXPAT.jpg 1,133 × 1,000; 109 KB
-
 PH effect.jpg 675 × 508; 29 KB
-
 PH otimo.tif 1,375 × 605; 138 KB
-
 Pioneer Factor in the Cell Differentiation.jpg 4,866 × 5,060; 1.24 MB
-
 Pioneer Factor's role in response of the external signal.jpg 3,259 × 3,065; 369 KB
-
 PiPolB.jpg 655 × 672; 29 KB
-
-
-
 PosterAutomationConference.jpg 1,945 × 2,391; 2.04 MB
-
 Pr Pfr.svg 1,052 × 744; 65 KB
-
 Prejav genu.jpg 251 × 221; 8 KB
-
 Proteine con ancore.jpg 960 × 720; 73 KB
-
 Protocol Overview of Reduced Representation Bisulfite Sequencing.png 10,048 × 4,097; 13.67 MB
-
 Prototype system.JPG 689 × 636; 61 KB
-
 PSI chart numStructures-vs-time.PNG 548 × 376; 13 KB
-
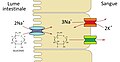
 PTS system 2.png 1,000 × 380; 55 KB
-
 Pulsatile ERK Activity Propagation Pattern around a wound.jpg 2,750 × 3,079; 1.22 MB
-
 Q-Zyklus-simple-asw.svg 350 × 700; 246 KB
-
 RAD50.png 635 × 397; 26 KB


.jpg)


_vs._Time_(MYA)_in_ACOT9.png)


.gif)


.png)
.png)

.png)
.png)
_(8007508031).png)


.png)


_12.43.40.png)