Category:Economy of Italy
Jump to navigation
Jump to search
economy of the country  Миланская Фондовая биржа | |||||
| Upload media | |||||
| Instance of | |||||
|---|---|---|---|---|---|
| Subclass of |
| ||||
| Currency | |||||
| PPP GDP per capita |
| ||||
| GDP (PPP) |
| ||||
| Nominal GDP |
| ||||
| Nominal GDP per capita |
| ||||
| Real GDP growth rate |
| ||||
| Inflation rate |
| ||||
| Total reserves |
| ||||
| VAT rate |
| ||||
| Location | Italy | ||||
| Currency | |||||
| |||||
Subcategories
This category has the following 71 subcategories, out of 71 total.
A
B
C
E
F
G
- Government debt of Italy (3 F)
H
I
- Italian Citizens' income (3 F)
L
M
- Marshall Plan in Italy (28 F)
N
O
P
R
- Receipts in Italy (41 F)
S
T
U
- Unemployment in Italy (7 F)
W
Media in category "Economy of Italy"
The following 86 files are in this category, out of 86 total.
-
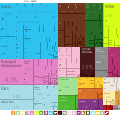
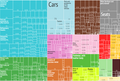 2012 Italy Products Export Treemap.png 1,500 × 1,008; 300 KB
-
 Aliquote IRPEF nazionali (1973-2022) - Italy's national Income Tax rates (1973-2022).png 7,031 × 3,749; 666 KB
-
 BruttostaatsschuldenEuro.png 958 × 593; 29 KB
-
 BruttostaatsschuldenEuroEngl.png 958 × 593; 30 KB
-
 Canoni medi di locazione in Italia.png 673 × 451; 55 KB
-
 Collage Italian economy.jpg 4,096 × 5,120; 3.63 MB
-
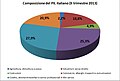 Composizione PIL Italia 2010.jpg 765 × 519; 63 KB
-
 Debito pubblico Comuni italiani.svg 868 × 546; 26 KB
-
 Debito pubblico Italia1997-2005.png 683 × 380; 8 KB
-
 Debito pubblico.jpg 909 × 485; 60 KB
-
 Debito-pubblico-1861-2019.png 1,240 × 777; 62 KB
-
 Debitopubblico-PIL.png 1,921 × 1,190; 114 KB
-
 Deficit-PIL Italia1996-2004.png 683 × 380; 12 KB
-

-
 Discorso Economico sopra la Maremma di Siena (page 5 crop).jpg 510 × 150; 30 KB
-
 Discorso Economico sopra la Maremma di Siena.pdf 400 × 625, 214 pages; 5.38 MB
-
 Distribution of Wealth in Italy.svg 800 × 600; 24 KB
-
 Domande accolte per reddito di emergenza.png 716 × 516; 67 KB
-
 Export-italiano-armi.jpg 400 × 294; 55 KB
-
 Exportaciones de Italia del periodo noviembre 2014-abril 2015.png 758 × 480; 33 KB
-
 FTSE MIB - 2020-2021.png 775 × 230; 16 KB
-
 G7 Countries GDP Per Capita (1990-2029).png 2,391 × 1,413; 317 KB
-
 GDP Indicators per capita of Italy (HY).png 2,064 × 1,322; 187 KB
-
 GDP per capita big four Western Europe.PNG 911 × 623; 38 KB
-
 GDP per capita development in Italy.jpg 1,035 × 651; 45 KB
-
 GDP per capita Italian regions bar graph.jpg 960 × 671; 278 KB
-
 GDP per capita, Big Four countries, 1970–2009 (Maddison).png 3,400 × 2,400; 475 KB
-
 GDP-top-counties.gif 531 × 311; 28 KB
-
 Gdpnordsudofitaly.png 1,192 × 673; 57 KB
-
 GiniPlots Italy.png 2,200 × 1,700; 30 KB
-
 Graficobot.jpg 960 × 720; 77 KB
-
 Historical GDP per capita development of Italy.svg 850 × 600; 50 KB
-

-
 Importaciones de Italia del periodo 2010-hasta abril 2015.png 758 × 480; 35 KB
-
 Importi medi mensili di Reddito di Cittadinanza.png 767 × 562; 64 KB
-
 Incidenza povertà familiare assoluta e relativa.png 715 × 438; 68 KB
-
 Inflazione Italia (1962 - febbraio 2022).png 2,550 × 1,200; 110 KB
-
 Inflazione Italia1996-2005.png 683 × 380; 10 KB
-
 Inflazione italiana.jpg 872 × 495; 96 KB
-
 Iscrizione Dazio Antignano 100 4674.JPG 2,304 × 1,728; 747 KB
-
 ISEW-SWI - Italia (1960-2013) -- ISEW-SWI - Italy (1960-2013).png 4,991 × 2,860; 395 KB
-
 Italian current account balance.jpg 828 × 521; 65 KB
-
 Italian unemployment rate.png 811 × 470; 27 KB
-
 Italy bonds.webp 5,231 × 1,441; 223 KB
-
 Italy Export Treemap.jpg 2,668 × 2,086; 2.28 MB
-
 Italy Exports Treemap 2017.svg 900 × 900; 558 KB
-
 Italy GDP.webp 1,564 × 389; 10 KB
-
 Italy household income.svg 1,200 × 750; 12 KB
-
 Leggi emanate Italia1997-2005.png 683 × 380; 9 KB
-
 Logo CSQ.png 604 × 602; 43 KB
-
 Made in Italy.png 197 × 16; 3 KB
-
 Ministerio Delle Politiche Agricole Alimentari E Forestali (16982951671).jpg 2,588 × 2,588; 5.57 MB
-
 NEMA B Curve.jpg 720 × 353; 27 KB
-
 Numero totale di progetti per componente nel PNNR.png 883 × 354; 105 KB
-
 Occupati in Italia -- Employees in Italy (1977-2023).png 5,889 × 3,342; 616 KB
-

-
 Occupazione Italia1996-2004.png 683 × 380; 13 KB
-
 Patologia atti amministrativi.png 791 × 425; 44 KB
-
 Percentualesettorioccupazionalisardegna.png 545 × 386; 7 KB
-
 PIL Italia 2000-2011.jpg 887 × 459; 72 KB
-
 PIL Italia 2006.jpg 639 × 424; 37 KB
-
 PIL Italia 2011 scomposizione.png 515 × 566; 23 KB
-
 Pil italia evoluzione.svg 900 × 600; 10 KB
-
 PIL Italia III-2009.png 530 × 672; 77 KB
-
 PIL Italia III-2009.svg 512 × 654; 12 KB
-
 PIL Italia1996-2005.png 683 × 380; 13 KB
-

-
 PIL YoY Q2 2011 paesi europei - GDP YoY Q2 2011 European countries.png 4,544 × 3,174; 159 KB
-
 PILpc italiano 13102017.png 1,402 × 930; 92 KB
-
 PreisindizesEngl.png 968 × 614; 35 KB
-
 PreisindizesKonsum.png 968 × 614; 34 KB
-
 Rating sovrano dell'Italia (1986 - 2021) - Italy's debit rating (1986 - 2021).png 5,551 × 3,516; 291 KB
-
 Real GDP per capitas of countries relative to the US' MDP.png 960 × 642; 68 KB
-
 Salario medio annuo in dollari.png 868 × 568; 64 KB
-
 Saldo negativo bilancia commerciale in Italia.png 807 × 463; 161 KB
-
 Saldo positivo bilancia commerciale in Italia.png 854 × 460; 171 KB
-
 Serie storica del numero di occupati e pensionati in Italia.png 649 × 472; 63 KB
-
 Serie storiche di occupati, disoccupati e inattivi in Italia.png 600 × 406; 32 KB
-
 Situazione lavorativa degli italiani nel 2023.png 814 × 471; 43 KB
-
 Società-persone e capitali.png 937 × 289; 106 KB
-
 Spesa pubblica italiana 1919-1944.png 5,441 × 2,999; 460 KB
-

-
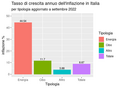 Tasso di crescita dell'inflazione in Italia per tipologia.png 493 × 361; 19 KB
-
 Tasso di occupazione in Italia.png 673 × 449; 47 KB
-
 Variazione-annuale-del-PIL 1990-2021.png 1,239 × 796; 58 KB
-
 World Lead Production.jpg 861 × 418; 48 KB

_-_Italy%27s_national_Income_Tax_rates_(1973-2022).png)


_-_2022.png)


.png)
.png)


.png)


_-_car_sales_(Italy_since_1928_-_Europe_since_2000).png)


.png)


_--_ISEW-SWI_-_Italy_(1960-2013).png)


.jpg)

.png)
_--_Employees_and_pensioners-retired_in_Italy_(1977-2022).png)


_-_Italy_quarter_GDP_at_Costant_prices_(Q3_2006_-_Q4_2019).png)


_-_Italy%27s_debit_rating_(1986_-_2021).png)


_-_Interest_rate_on_Italy-France-Germany_10Y_bonds_(2008_-_2014).png)


.jpg)