Category:Economy of Portugal
Jump to navigation
Jump to search
Countries of Europe: Albania · Andorra · Armenia‡ · Austria · Azerbaijan‡ · Belarus · Belgium · Bosnia and Herzegovina · Bulgaria · Croatia · Cyprus‡ · Czech Republic · Denmark · Estonia · Finland · France‡ · Georgia‡ · Germany · Greece · Hungary · Iceland · Republic of Ireland · Italy · Kazakhstan‡ · Latvia · Liechtenstein · Lithuania · Luxembourg · Malta · Moldova · Monaco · Montenegro · Netherlands‡ · North Macedonia · Norway · Poland · Portugal‡ · Romania · Russia‡ · San Marino · Serbia · Slovakia · Slovenia · Spain‡ · Sweden · Switzerland · Turkey‡ · Ukraine · United Kingdom · Vatican City
Specific status: Faroe Islands · Gibraltar · Bailiwick of Guernsey · Isle of Man · Jersey · Svalbard – Limited recognition: Abkhazia‡ · Kosovo · South Ossetia‡ · Transnistria · Northern Cyprus‡
‡: partly located in Europe
Specific status: Faroe Islands · Gibraltar · Bailiwick of Guernsey · Isle of Man · Jersey · Svalbard – Limited recognition: Abkhazia‡ · Kosovo · South Ossetia‡ · Transnistria · Northern Cyprus‡
‡: partly located in Europe
Español: Economía de Portugal
Português: Economia de Portugal
economy of the country | |||||
| Upload media | |||||
| Instance of | |||||
|---|---|---|---|---|---|
| Subclass of |
| ||||
| Currency |
| ||||
| PPP GDP per capita |
| ||||
| GDP (PPP) |
| ||||
| Nominal GDP |
| ||||
| Nominal GDP per capita |
| ||||
| Real GDP growth rate |
| ||||
| Inflation rate |
| ||||
| Total reserves |
| ||||
| VAT rate |
| ||||
| Location | Portugal | ||||
| |||||
Subcategories
This category has the following 56 subcategories, out of 56 total.
*
+
- Economy of Lourinhã (7 F)
A
B
C
E
- Euronext Lisbon (2 F)
F
G
- Guest houses in Portugal (5 F)
H
I
L
M
N
O
P
S
T
W
- Weighing scales in Portugal (3 F)
Media in category "Economy of Portugal"
The following 26 files are in this category, out of 26 total.
-
 2006Portuguese exports.PNG 1,425 × 625; 59 KB
-
 Arredores de Oleiros - Portugal (52827136103).jpg 2,048 × 1,364; 2.28 MB
-
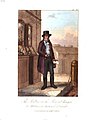 Costume of Portugal by Henry L'Evêque 152.jpg 1,000 × 1,352; 452 KB
-
 Despesas mensais com o automóvel em Portugal.png 794 × 1,007; 51 KB
-
 Divisions of government.PNG 737 × 394; 145 KB
-
 Economia de Portugal.png 2,848 × 4,144; 14.75 MB
-
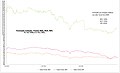
 Evolucao Titulo BCP 1999 2003.jpg 1,235 × 742; 371 KB
-
 Evolucao Titulos BCP BES BPI 1999 2003.jpg 1,231 × 398; 147 KB
-
 Evolucao Titulos BCP BES BPI 2000 2002.jpg 1,256 × 769; 253 KB
-
 Flickr - nmorao - Alfa Pendular 122, Riachos, 2009.12.19.jpg 2,136 × 1,420; 3.93 MB
-
 Flickr - nmorao - Alfa Pendular 184, Alcácer, 2008.06.28 (1).jpg 1,024 × 767; 454 KB
-
 Flickr - nmorao - Areia, Alcácer, 2008.06.28 (1).jpg 1,024 × 767; 369 KB
-
 Flickr - nmorao - Areia, Estação da Somincor, 2009.04.01 (1).jpg 2,136 × 1,420; 3.45 MB
-
 Flickr - nmorao - Contentores, Alcácer, 2008.10.02.jpg 1,024 × 767; 399 KB
-
 Maurício Korbivcher.jpg 3,388 × 2,259; 6.92 MB
-
 Monte das Flores train station Linha de Evora Portugal.jpg 2,136 × 1,420; 3.69 MB
-
 Movimento560.jpg 566 × 210; 56 KB
-
 PIIGGSmap.svg 454 × 450; 478 KB
-
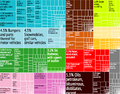 Portugal Export Treemap.png 853 × 667; 212 KB
-
 Portugal Exports Treemap 2017.svg 900 × 900; 550 KB
-
 Portugal Product Exports (2019).svg 1,100 × 715; 584 KB
-
 Portuguese exports-fr.svg 940 × 415; 1.51 MB
-
 Recibo verde electrónico.png 640 × 462; 138 KB
-
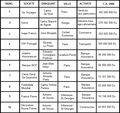 Sociétés portugaises de France.png 600 × 565; 32 KB
-
 ЄС.jpg 460 × 268; 37 KB
-
 Португалия.svg 600 × 371; 162 KB

.jpg)


.jpg)
.jpg)
.jpg)


.svg)


