Category:Economy of the United Kingdom
Vai alla navigazione
Vai alla ricerca
economia  Bank of England, London | |||||
| Carica un file multimediale | |||||
| Istanza di | |||||
|---|---|---|---|---|---|
| Sottoclasse di | |||||
| Valuta | |||||
| PIL (PPA) pro capite |
| ||||
| PIL (PPA) |
| ||||
| PIL nominale |
| ||||
| PIL pro capite |
| ||||
| Tasso di crescita |
| ||||
| Tasso d'inflazione |
| ||||
| Riserve totali |
| ||||
| Aliquota IVA |
| ||||
| Luogo | Regno Unito | ||||
| |||||
Sottocategorie
Questa categoria contiene le 74 sottocategorie indicate di seguito, su un totale di 74.
!
*
+
A
B
- Baron Dickinson Webster (1 F)
C
D
E
- Enso Group (6 F)
F
G
H
I
J
K
- Fred Karno (6 F)
L
M
- MONIAC (11 F)
N
O
P
- Adam Parr (2 F)
R
- Royal United Services Institute (41 F)
S
T
U
W
File nella categoria "Economy of the United Kingdom"
Questa categoria contiene 140 file, indicati di seguito, su un totale di 140.
-

-
 "Sign of the times" (5153506567).jpg 1 500 × 2 000; 1,36 MB
-
 1835 Morning Post, April 6.jpg 2 064 × 582; 406 KB
-
 2001 Numbers of Titles published in the UK.png 631 × 523; 34 KB
-
 2003 Brecqhou Barclay brothers.JPG 500 × 288; 27 KB
-
 2005UK goods exports.PNG 1 425 × 625; 61 KB
-
 2005UK services exports.PNG 1 425 × 625; 59 KB
-
 2008 UK Book Sales Value.png 611 × 497; 23 KB
-
 2008 UK Book Sales Volume.png 669 × 503; 24 KB
-
 Accident Repair Centre - panoramio.jpg 832 × 624; 238 KB
-
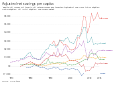 Adjusted net savings per capita, OWID.svg 850 × 600; 19 KB
-
 An ABE Information Stall.jpg 604 × 453; 41 KB
-
 Average household income in the UK from 1977 to 2021.svg 2 403 × 1 837; 12 KB
-
 Average weekly earnings over time seasonally adjusted in the UK.svg 2 101 × 1 723; 21 KB
-
 Bagehot - Lombard Street, 1873 - 5747415.tif 1 740 × 2 819; 14,1 MB
-
 BiodieselsUK.jpg 1 013 × 576; 168 KB
-
 Bobby Cummines OBE MUniv. FRSA.png 183 × 225; 25 KB
-
 Book of murder.gif 443 × 720; 8 KB
-
 Brexit protest (49478358738).jpg 6 000 × 4 000; 7,56 MB
-
 Contribution to GDP (% points) broken down into sectors.jpg 600 × 986; 36 KB
-
 Contributions to the UK economy in 2011 by region.png 576 × 960; 234 KB
-
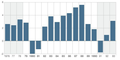
 Crescimento do PIB do Reino Unido entre 1949 e 2009.png 687 × 430; 22 KB
-
 Crescimento do PIB do Reino Unido entre 1976 e 1993.png 602 × 299; 60 KB
-
 Demos think tank logo.JPG 591 × 123; 28 KB
-
 Dette britannique longue période - 2.png 2 818 × 1 441; 27 KB
-
 Dette britannique longue période.png 672 × 422; 39 KB
-
 EDG Boardrooms.jpg 200 × 160; 14 KB
-
 Entrepreneurs for Britain Letter To Conservative MPs.jpg 2 100 × 1 526; 615 KB
-
 Ernst&young logo.svg 278 × 36; 8 KB
-
 Eundd1.jpg 832 × 275; 98 KB
-

-
 Exporters and importers in Great Britain, 2011.png 600 × 1 756; 114 KB
-

-

-
-

-

-

-
-

-
 FSCS awareness campaign poster 1 2013.jpg 1 760 × 2 953; 229 KB
-
 G7 Countries GDP Per Capita (1990-2029).png 2 379 × 1 380; 380 KB
-
 GDP increased in all four quarters of 2013.jpg 600 × 612; 26 KB
-
 GDP per capita big four Western Europe.PNG 911 × 623; 38 KB
-
 GDP per capita, Big Four countries, 1970–2009 (Maddison).png 3 400 × 2 400; 475 KB
-
 GDP Preliminary Estimate Q1 2014.png 600 × 2 333; 120 KB
-
 GDP-top-counties.gif 531 × 311; 28 KB
-
 GiniPlots UK.png 2 200 × 1 700; 31 KB
-
 Great Linford Manor - geograph.org.uk - 1157692.jpg 640 × 480; 76 KB
-
 Grid BW.jpg 1 000 × 1 000; 104 KB
-

-
 Gross Domestic Product (GDP) preliminary estimate Q2 2014.png 600 × 2 305; 112 KB
-
 How ONS products explain the UK economy.jpg 791 × 683; 62 KB
-
 How ONS statistics explain the UK economy Feb 2012 (8790240798).jpg 675 × 960; 141 KB
-
 ILM basic logo.jpg 90 × 77; 2 KB
-

-

-
 Individual insolvencies in england and wales, 1960 to 2007.png 709 × 320; 18 KB
-
Inflation rises, postal workers day, animal rights and more.ogv 8 min 53 s, 1 920 × 1 080; 257,61 MB
-
 Labour Market Summary Infographic, June to August 2013.png 635 × 2 760; 200 KB
-
 Labour productivity historical data.png 2 503 × 12 544; 1,12 MB
-
 Latest on the UK Labour Market, November 2013 to January 2014.png 635 × 2 616; 155 KB
-
 Local authorities with the highest and lowest employment rates.png 1 000 × 1 498; 199 KB
-
 MapBritishTrade-1907-0923.jpg 8 800 × 7 293; 21,28 MB
-
 Mark Summers, CEO of SCORCCiO Sample Replays.jpg 288 × 366; 126 KB
-
 Matthew Newbury.jpg 4 042 × 2 695; 5,85 MB
-
 Merchandise exports by destination, OWID.svg 850 × 600; 30 KB
-
 Miles flint.jpg 250 × 307; 19 KB
-
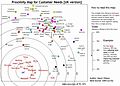 NeedsMap.jpg 480 × 342; 50 KB
-
 NewIFALogo.jpg 5 518 × 1 584; 619 KB
-
 Nicholas Vansittart, 1st Baron Bexley (1766-1851).jpg 847 × 900; 115 KB
-
 Official Albums Chart.png 1 169 × 204; 48 KB
-
 OGC Share of civil estate by area.PNG 559 × 502; 33 KB
-
 Overseas Business Risk (5930908299).jpg 2 136 × 1 424; 468 KB
-

-

-
 PIIGGSmap.svg 454 × 450; 478 KB
-
 PopulationworkhouseUK.gif 338 × 249; 5 KB
-
 Press Association RGB Hires.jpg 2 940 × 757; 192 KB
-
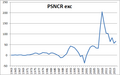 PSNCR exc.png 505 × 315; 9 KB
-
 Punch Poor Law.jpg 270 × 354; 28 KB
-
 Quarterly adjusted England starts completions.png 699 × 603; 43 KB
-
 Radcliffe Blaze.jpg 2 560 × 1 920; 1,5 MB
-
 RentUSAGerFraBri 02.png 767 × 625; 22 KB
-

-
 Saul Klein.jpg 3 354 × 2 256; 3,46 MB
-

-
 The Labour Market in the UK - September 2013.png 635 × 3 868; 285 KB
-

-
 The Poacher's Relish.JPG 1 703 × 1 670; 1,15 MB
-
 The Young Foundation Logo.jpg 1 071 × 677; 198 KB
-
 Theo Paphitis.jpg 900 × 604; 409 KB
-
 ToadLane2009.jpg 3 664 × 2 748; 5,05 MB
-
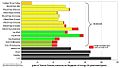
 Top 10 countries importing UK manufactured goods (15405626787).jpg 4 167 × 2 214; 1,2 MB
-
 Trade agreements of the United Kingdom.png 6 300 × 3 095; 1,67 MB
-
 Trade share by type of trade, OWID.svg 850 × 600; 8 KB
-
 Tranmere oil terminal - geograph.org.uk - 291919.jpg 640 × 480; 47 KB
-
 U.K Internal Market (devolved powers).jpg 960 × 640; 118 KB
-
 U.K. balance of tarde in goods since 1870.png 800 × 516; 26 KB
-
 U.K.-Corporate-Tax-Revenues-As-GDP-Percentage-(75-05).JPG 483 × 291; 26 KB
-
 Uk bonds.webp 1 431 × 493; 20 KB
-
 UK Budget 2010 borrowing forecast.png 800 × 600; 10 KB
-
 UK budget charts 2019-2020.png 495 × 610; 121 KB
-
 UK debt compared to Eurozone average.png 694 × 735; 47 KB
-
 UK economic growth graph - April 26, 2008.png 309 × 416; 18 KB
-
 UK employment by broad sector range.svg 3 632 × 2 922; 22 KB
-

-
 UK employment of population in private and public sectors by percentage.svg 2 156 × 1 896; 4 KB
-
 UK Festival Awards 2012 Logo.png 3 500 × 887; 221 KB
-
 UK FIT Scheme.jpg 946 × 555; 78 KB
-
 UK GDP per capita by region 2018.png 1 296 × 1 662; 418 KB
-
 UK government benefits 2011.png 1 270 × 881; 31 KB
-
 UK house prices Nationwide.png 970 × 604; 19 KB
-
 Uk Inflation data.webp 3 101 × 847; 59 KB
-
 UK labour market Feb - Apr 2014.png 635 × 1 861; 142 KB
-
 UK National Minimum Wage to 2014.svg 808 × 436; 61 KB
-
 UK National Minimum Wage to 2015.svg 808 × 436; 79 KB
-
 UK public sector employment March 2014.png 635 × 867; 101 KB
-
 UK RHI Scheme.jpg 595 × 494; 43 KB
-
 UK singles chart.jpg 628 × 232; 48 KB
-
 UK tax NIC pounds.svg 512 × 384; 282 KB
-
 UK taxes.svg 707 × 487; 43 KB
-
 UK top income tax and inequality.png 652 × 415; 56 KB
-
 UK unemployment rises by 70,000, Dec 2012 - Feb 2013.png 635 × 850; 90 KB
-
 UK-Government-Expenditure-2016-17.jpg 3 450 × 1 871; 421 KB
-
 UKExpenditure.svg 596 × 392; 37 KB
-
 Ukindialogo.PNG 124 × 73; 7 KB
-
 UKinflation change.png 437 × 363; 38 KB
-
 UKinflation.png 539 × 438; 27 KB
-
 UkResidentialRePrice.svg 768 × 432; 73 KB
-
 United Kingdom bonds.webp 5 286 × 2 103; 426 KB
-
 United Kingdom Exports Treemap 2017.svg 900 × 900; 536 KB
-
 VikingCentreJarrow.jpg 2 576 × 1 932; 1,25 MB
-

-
Wikipedia-VideoWiki-United Kingdom video article.webm 2 min 17 s, 1 067 × 600; 16,21 MB
-
 Window Tax.jpg 1 048 × 1 485; 292 KB
-
 Working and Workless Households 2013.png 635 × 5 190; 319 KB
-
 Workless households across the UK, 2012.png 635 × 2 995; 231 KB
-
 Índices de desemprego no Reino Unido entre 1976 e 1993.png 593 × 307; 62 KB
-
 Índices de inflação no Reino Unido entre 1976 e 1993.png 598 × 298; 80 KB
_london%27s_1944_Industrial_Savings_Campaign_(verso)_Art.IWMPST15497_(cropped).jpg)
.jpg)


.jpg)
_broken_down_into_sectors.jpg)


.png)


.png)


_across_the_UK_mapped_in_2020.svg)

.jpg)
_-_car_sales_(Italy_since_1928_-_Europe_since_2000).png)


.jpg)

.jpg)
.png)


_london%27s_1944_Industrial_Savings_Campaign_(verso)_Art.IWMPST15497.jpg)


.jpg)


.jpg)

.JPG)


_preliminary_estimate_Q2_2014.png)
.png)