Category:Genome-wide association studies
Jump to navigation
Jump to search
examination of many genetic variants in different individuals to see if any variant is associated with a trait | |||||
| Upload media | |||||
| Subclass of |
| ||||
|---|---|---|---|---|---|
| |||||
Subcategories
This category has the following 4 subcategories, out of 4 total.
Media in category "Genome-wide association studies"
The following 49 files are in this category, out of 49 total.
-
13059 2024 3202 Fig5 HTML (1).jpg 729 × 898; 163 KB
-
-
A-SEL1L-Mutation-Links-a-Canine-Progressive-Early-Onset-Cerebellar-Ataxia-to-the-Endoplasmic-pgen.1002759.s007.ogv 1 min 37 s, 640 × 480; 19.73 MB
-
A-SEL1L-Mutation-Links-a-Canine-Progressive-Early-Onset-Cerebellar-Ataxia-to-the-Endoplasmic-pgen.1002759.s008.ogv 1 min 56 s, 640 × 480; 23.41 MB
-
A-SEL1L-Mutation-Links-a-Canine-Progressive-Early-Onset-Cerebellar-Ataxia-to-the-Endoplasmic-pgen.1002759.s009.ogv 1 min 48 s, 640 × 480; 18.26 MB
-
-
Animation scroll (1).gif 1,377 × 871; 6.08 MB
-
Combining-high-throughput-phenotyping-and-genome-wide-association-studies-to-reveal-natural-genetic-ncomms6087-s4.ogv 3 min 1 s, 1,280 × 720; 55.23 MB
-
Combining-high-throughput-phenotyping-and-genome-wide-association-studies-to-reveal-natural-genetic-ncomms6087-s5.ogv 1 min 20 s, 800 × 600; 5.39 MB
-
-
-
-
-
Example of a Genome-wide QTL-Scan from PLoS Biology.jpg 4,028 × 2,885; 976 KB
-
Gene association with regionalized facial features in normal populations.png 2,924 × 2,130; 1.97 MB
-
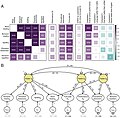
Genes of reading- and language-related traits largely independent of performance IQ.jpg 2,918 × 2,865; 910 KB
-
Genetic correlation results about traits, IQ and language skills.jpg 2,920 × 3,875; 1.22 MB
-
Genetic correlations of brain imaging traits and language skill-levels.jpg 2,024 × 662; 182 KB
-
Genetic variants associated with IQ.png 1,412 × 850; 340 KB
-
Genome-wide association studies.png 684 × 260; 100 KB
-
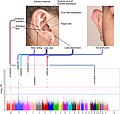
Genome-wide associations of pinna traits.jpg 946 × 898; 163 KB
-
-
-
-
Genotype phenotype regression.svg 360 × 360; 378 KB
-
GWAS Disease allele effects rus.png 2,179 × 1,591; 248 KB
-
GWAS Disease allele effects.png 1,922 × 1,417; 265 KB
-
GWAS disease allele effects.tif 1,922 × 1,417; 526 KB
-
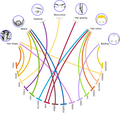
GWAS loci influencing human facial and scalp hair phenotypes.png 946 × 1,472; 733 KB
-
GWAS-Übersicht.svg 467 × 842; 882 KB
-
GWAS.png 648 × 486; 217 KB
-
Journal.pone.0048294.g003.png 1,993 × 1,041; 306 KB
-
Manhattan plot from a GWAS of kidney stone disease.png 2,432 × 1,050; 918 KB
-
Manhatton Plot GWAS study ALS.png 3,000 × 1,800; 366 KB
-
Method example for GWA study designs.png 960 × 720; 45 KB
-
Minor allele frequency versus effect size.png 1,632 × 1,632; 316 KB
-
-
PICALM-modulates-autophagy-activityand-tau-accumulation-ncomms5998-s2.ogv 10 s, 186 × 186; 1.05 MB
-
PICALM-modulates-autophagy-activityand-tau-accumulation-ncomms5998-s3.ogv 10 s, 175 × 178; 246 KB
-
PICALM-modulates-autophagy-activityand-tau-accumulation-ncomms5998-s4.ogv 10 s, 172 × 175; 305 KB
-
PICALM-modulates-autophagy-activityand-tau-accumulation-ncomms5998-s5.ogv 10 s, 168 × 174; 312 KB
-
Regional Association Plot.png 966 × 800; 165 KB
-
-
-
-
-
Toxgnostic GWAS discovery pathway.png 579 × 453; 77 KB


