Category:Population genetics
Jump to navigation
Jump to search
English: Population genetics provides the mathematical and theoretical underpinnings of evolutionary biology.
subfield of genetics that deals with genetic differences of populations, part of evolutionary biology  | |||||
| Upload media | |||||
| Instance of |
| ||||
|---|---|---|---|---|---|
| Subclass of | |||||
| Has part(s) | |||||
| Founded by |
| ||||
| |||||
Subcategories
This category has the following 46 subcategories, out of 46 total.
*
A
- Ancestry informative markers (11 F)
B
- Biopiracy (19 F)
C
- Conservation genetics (17 F)
D
E
- Effective population size (3 F)
F
G
- Generation time (2 F)
H
- Haplotype (1 F)
- Hardy–Weinberg law (10 F)
I
L
- Linkage disequilibrium (4 F)
M
O
- Outbreeding depression (2 F)
P
- Positive selection (4 F)
S
V
Media in category "Population genetics"
The following 196 files are in this category, out of 196 total.
-
-
-
-

-
 ADMIXTURE analysis at K8 ancestral components with global populations.jpg 2,300 × 1,197; 623 KB
-
 ADMIXTURE analysis of indigenous Malaysians, Andamanese, and Malays.webp 1,668 × 2,358; 180 KB
-
 Admixture graph of deep Eurasian lineages.png 3,885 × 3,932; 533 KB
-
 ADNNorafricanoPeninsulaIberica.jpg 1,003 × 592; 157 KB
-
 Allele-frequency bg.png 1,280 × 692; 409 KB
-
 Allele-frequency hu.png 1,639 × 1,661; 612 KB
-
 Allele-frequency pt.jpg 333 × 360; 100 KB
-
 Allele-frequency ru.png 333 × 360; 68 KB
-
 Allele-frequency-fr.png 3,114 × 2,837; 510 KB
-
 Allele-frequency.png 333 × 360; 55 KB
-
 Allentoft et al. 2024 PCA.webp 2,102 × 1,576; 283 KB
-
 An admixture graph model of Paleolithic West Eurasians.png 768 × 1,468; 774 KB
-
 Ancestry component analysis of South Asian populations.jpg 968 × 248; 63 KB
-
-
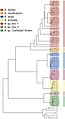
 Ancient Comparison (SharedDNA) T1a1.png 1,002 × 408; 64 KB
-
 Ancient horse remains and their genomic affinities.webp 2,070 × 1,797; 381 KB
-
 Ancient North Eurasians in context of West and East Eurasian Core populations.png 3,232 × 2,556; 6.25 MB
-
 Avesthagen.jpg 267 × 87; 5 KB
-
 Bateson-Dobzhansky-Muller model. .jpg 1,208 × 699; 68 KB
-
 Bateson-Dobzhansky-Muller model.jpg 1,231 × 703; 68 KB
-
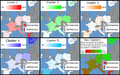 Bauchet European clusters.png 1,954 × 1,222; 847 KB
-

-
 Bronze to Iron Age Steppe peoples genetic makeup.png 592 × 766; 143 KB
-
Call-Cultures-in-Orang-Utans?-pone.0036180.s001.ogg 3.5 s; 35 KB
-
Call-Cultures-in-Orang-Utans?-pone.0036180.s002.ogg 6.0 s; 32 KB
-
Call-Cultures-in-Orang-Utans?-pone.0036180.s003.ogg 1.0 s; 11 KB
-
Call-Cultures-in-Orang-Utans?-pone.0036180.s004.ogg 5.6 s; 53 KB
-
 Chromosomal Recombination ka.svg 517 × 334; 28 KB
-
 Chromosomal Recombination.svg 517 × 334; 25 KB
-

-
 Cladogram.png 569 × 1,000; 44 KB
-
 Closest populations genetically to Anatolian Neolithic Farmers.png 377 × 1,027; 90 KB
-
 Comparison of 3 by Y-DNA haplogroups in Northwestern Europe.png 475 × 461; 16 KB
-
 Conserved residues.svg 193 × 500; 102 KB
-
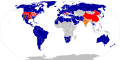 CousinMarriageWorld.svg 940 × 470; 2 MB
-
 Danaan genepool.png 402 × 541; 209 KB
-
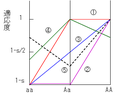
 Desequilibrio.svg 450 × 360; 49 KB
-
 Dev-code-met-Ile.jpg 1,852 × 1,616; 167 KB
-

-

-

-

-

-

-
-
-
-
 Disease Gene Mapping with Multiple Chromosomes.jpg 2,207 × 2,689; 838 KB
-
 DNAtreeYconnections.png 574 × 511; 15 KB
-
 DQ Illustration.PNG 274 × 203; 7 KB
-
 Ehstrafd logo.png 200 × 109; 22 KB
-
 Eurasian genetic ancestry components (K8).jpg 1,518 × 1,416; 405 KB
-
 European genetic structure (based on SNPs) PC analysis.png 2,067 × 1,552; 1.12 MB
-
 European population substructure.png 1,792 × 1,280; 981 KB
-
 Evol biol model.png 1,748 × 993; 528 KB
-
 Evolsex-dia2a.svg 700 × 483; 8 KB
-
 Evolution of bet hedging.png 581 × 373; 24 KB
-
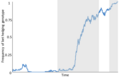
 Evolution of the Dominican Republic's genetic make-up.jpg 768 × 740; 52 KB
-
 F3.large.jpg 1,280 × 1,088; 96 KB
-
 Fitness-landscape-cartoon-vector.svg 484 × 238; 79 KB
-
 Fitness0.png 319 × 253; 9 KB
-
 Fitness1.png 321 × 260; 10 KB
-
 Fixation example graph kr.png 1,111 × 669; 305 KB
-
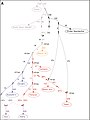
 Formation process of regional population in mainland Japan.jpg 3,368 × 1,898; 554 KB
-
 Founder effect-anim.gif 800 × 800; 937 KB
-
 Gaelic genepool in western europe.png 321 × 454; 89 KB
-
 Gene flow final.png 1,531 × 724; 89 KB
-
 Gene-distribution.png 1,459 × 444; 89 KB
-
 Genes mirror.jpg 521 × 478; 87 KB
-

-
 Genetic affinities between ancient and modern populations.jpg 1,346 × 1,204; 179 KB
-
 Genetic distance of various races.png 1,418 × 1,065; 838 KB
-
 Genetic history of Stone Age Eurasian.jpg 5,840 × 8,512; 16.71 MB
-
 Genetic links between Tibeto-Burman speakers.webp 2,001 × 1,275; 142 KB
-
 Genetic makeup of the Saka and Scythian cultures.png 3,164 × 1,840; 12.82 MB
-
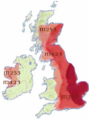
 Genetic structure in England.png 1,632 × 2,016; 403 KB
-
 Genetic structure of ancient Europe.webp 946 × 597; 77 KB
-
 Genetic Structure of Europeans - Nelis et alli 2009.png 1,182 × 966; 491 KB
-
-
 Gentic Map of Europe.png 781 × 544; 181 KB
-
 Geographic location and dates of ancient individuals in Northern East Asia.png 1,715 × 1,761; 2.04 MB
-
 Gráfico de discriminación alélica.jpg 555 × 692; 68 KB
-
 Haplorrhini2.jpg 360 × 424; 21 KB
-
 HardSelectiveSweep.jpg 1,125 × 2,250; 343 KB
-
 Hardy & Weinberg.png 922 × 663; 569 KB
-
 Heritability.svg 1,052 × 744; 34 KB
-
 Heterocigosidad máxima vs. número de alelos.svg 511 × 321; 102 KB
-
 HgE1b1b1a2.png 1,013 × 758; 171 KB
-
 Hiệu ứng Wahlund.png 1,377 × 356; 29 KB
-
 Horse geographic and genetic affinities.webp 1,049 × 1,476; 221 KB
-
 Human genetic isolation by distance in Kanitz 2018.png 642 × 707; 92 KB
-
 IBD SIM 2.png 560 × 734; 122 KB
-
 IBD SIM.png 560 × 734; 122 KB
-
 Illustr gauss adapt.gif 407 × 246; 3 KB
-
 Ipotesi multiregionale.jpg 663 × 572; 109 KB
-
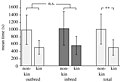 Kin recognition Frommen and Baker.large.jpg 1,800 × 1,229; 121 KB
-
 LacIntol-World2.png 1,427 × 628; 52 KB
-
 Laktoseintoleranz-1.svg 2,535 × 1,263; 1.44 MB
-
 Layzer.png 400 × 300; 6 KB
-
 Life cycle of a sexually reproducing organism.svg 500 × 450; 21 KB
-
 Locus vs misclassification.svg 700 × 750; 28 KB
-
 Maasai Genomic Ancestry.jpg 801 × 596; 108 KB
-

-
 MicrofluidicsII.png 954 × 1,127; 117 KB
-
 Molecular lineage.png 300 × 300; 6 KB
-
 MultiRegional.png 329 × 277; 10 KB
-
 Natural selection flowchart.png 1,280 × 682; 1.37 MB
-
 Neighbor-joining Tree (Editable).svg 725 × 459; 456 KB
-
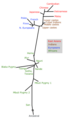
 Neo mig oppenheimer.png 850 × 650; 45 KB
-

-
-
 North America birds.jpg 618 × 800; 97 KB
-
 NorthAfricanAdmixtureIberianPeninsula.jpg 968 × 597; 136 KB
-
 Overview of the genetic history of the Bronze to Iron Age Eurasian Steppe.jpg 6,648 × 4,160; 7.21 MB
-
 Paleo mig oppenheimer.png 1,000 × 750; 135 KB
-
 PaleoChart2.jpg 960 × 624; 76 KB
-
 PaleopolyploidyTree.jpg 847 × 861; 264 KB
-
 Palestinians hla.pdf 1,458 × 1,818, 12 pages; 2.36 MB
-
 PCA of Haplogroup J from 6 STRs.png 687 × 552; 15 KB
-
 PCA of Haplogroup J using 37 STRs.png 683 × 564; 19 KB
-
 PCA of masked South Asian ancestry models.jpg 1,080 × 1,605; 199 KB
-

-
 PdistVsNforTMRCA194kya.PNG 589 × 385; 14 KB
-
 Peopling of Eastern Eurasia.png 1,482 × 1,316; 180 KB
-
 Pfix of beneficial mutations.jpg 2,400 × 1,725; 188 KB
-
 Pfix of deleterious mutations with drift barrier.jpg 2,010 × 1,725; 183 KB
-
 Phylogenetic graph on formation of Native Americans.jpg 2,225 × 2,916; 396 KB
-
 Phylogenetic tree of F23 (Jomon) and modern humans.jpg 2,122 × 1,520; 353 KB
-
 Phylogeny of diverse species of the Aphonopelma tarantula genus.jpg 1,115 × 2,048; 241 KB
-
 Population bottleneck ca.svg 440 × 373; 4 KB
-
 Population genetic affinities, evolutionary history and geographic origins.webp 2,093 × 2,053; 262 KB
-
 Population Genetics - Gamate Mix (4 to 10).jpg 528 × 192; 15 KB
-
 Population genomic data of Central Asians.png 1,048 × 698; 169 KB
-
 Population genomics (worldwide sampling).png 685 × 456; 88 KB
-
 Population structure europe I.png 872 × 750; 230 KB
-
 Population structure europe II.png 934 × 766; 222 KB
-
 Principal Component Analysis of European populations from the Genome Ukraine Project.png 1,580 × 1,008; 336 KB
-
 Principal Components Analysis of Ancient West Eurasians.jpg 2,233 × 1,755; 440 KB
-
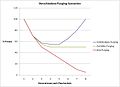 Purging.JPG 911 × 664; 44 KB
-
 Purging.svg 911 × 664; 16 KB
-
 QpAdm model of Ulaanzuukh and Slab Grave remains.jpg 3,000 × 564; 205 KB
-
 QpAdm model of Ulaanzuukh, Slab Grave and Xiongnu TAK and SBB individuals.jpg 3,000 × 1,616; 448 KB
-
 QpAdm-model for selected Eurasian populations.jpg 653 × 399; 71 KB
-
 QpGraph analysis of South Asian populations.jpg 1,080 × 911; 87 KB
-
 QpGraph model of N and S ancestries of South Asians.jpg 1,904 × 3,794; 431 KB
-
 QpGraph on ancient population lineages.jpg 1,080 × 1,920; 165 KB
-
 QpGraph trees for Paleolithic Eurasia (A).jpg 2,114 × 2,818; 422 KB
-
 QpGraph trees for Paleolithic Eurasia (B).jpg 1,795 × 2,822; 389 KB
-
 Realized Heritability.svg 561 × 564; 200 KB
-
-
 Relationship and legacy of the West and East Eurasian Core populations.webp 2,000 × 1,688; 162 KB
-
 Representacion grafica.jpg 907 × 589; 75 KB
-
 RILs population construction.jpg 960 × 720; 102 KB
-
 Rosenberg2007.png 544 × 4,037; 836 KB
-
 Schemat punneta2.svg 593 × 590; 46 KB
-
 Schematic of Populations in Eurasia from 45 to 10 kaBP (migration routes).png 1,002 × 571; 288 KB
-
 Scythian genetic makeup.png 744 × 576; 166 KB
-
 Selection Chart it.png 588 × 431; 76 KB
-
 Selection Chart.PNG 588 × 431; 20 KB
-
 Selective sweep, frequency vs time-be.jpg 400 × 300; 16 KB
-
 Selective sweep, frequency vs time.jpg 400 × 300; 19 KB
-
 Selektion,Stabilisierend.svg 200 × 200; 8 KB
-
 Sex A.gif 778 × 529; 12 KB
-
 Sex B.gif 768 × 568; 9 KB
-
 Sex Linked changes in generations.svg 546 × 344; 63 KB
-
 Sickle cell gene under selection.png 553 × 412; 7 KB
-
 Single locus.png 420 × 300; 12 KB
-
 Single locus.svg 1,052 × 744; 23 KB
-
 SNP haplotype sharing between worldwide populations.png 602 × 905; 345 KB
-
 SNP saturation.PNG 389 × 328; 35 KB
-
 South Asian PCA West-East cline.png 1,920 × 838; 561 KB
-

-

-

-

-

-
 Strong-Purifying-Selection-at-Synonymous-Sites-in-D.-melanogaster-pgen.1003527.s002.tif 2,049 × 1,500; 197 KB
-
 Strong-Purifying-Selection-at-Synonymous-Sites-in-D.-melanogaster-pgen.1003527.s003.tif 2,049 × 2,757; 1.05 MB
-
 Structure plot of European populations from the Genome Ukraine Project.jpg 1,597 × 1,607; 824 KB
-
 Subspecies 1.png 250 × 200; 14 KB
-
 Tamaño efectiv.JPG 253 × 155; 8 KB
-

-
 Three loci.png 420 × 300; 18 KB
-
 Three loci.svg 1,052 × 744; 47 KB
-
 Three-way model of Neolithic admixture.png 1,033 × 423; 114 KB
-
 Trait-scale-bimodal.png 626 × 311; 17 KB
-
 Transitions-transversions-v2.png 978 × 978; 56 KB
-
 Transitions-transversions.png 889 × 889; 64 KB
-
 Weal.png 600 × 283; 53 KB
-
-
 Índex de diversitat de Simpson-Gini (I).jpg 184 × 25; 9 KB
-
 Հաճախականություն.jpg 800 × 600; 51 KB


.png)


.jpg)
_PC_analysis.png)


.svg)

.jpg)


_(ANE_and_ANS).png)


_and_modern_humans.jpg)


.png)


.jpg)
.jpg)


.png)


_T1a1.png)
.jpg)
.jpg)