File:Entwicklung der Stromerzeugung aus erneuerbaren Energien in Deutschland.svg

From Wikimedia Commons, the free media repository
Jump to navigation Jump to search

Original file(SVG file, nominally 700 × 480 pixels, file size: 60 KB)

Captions

Captions

Add a one-line explanation of what this file represents

Summary[edit]

Description
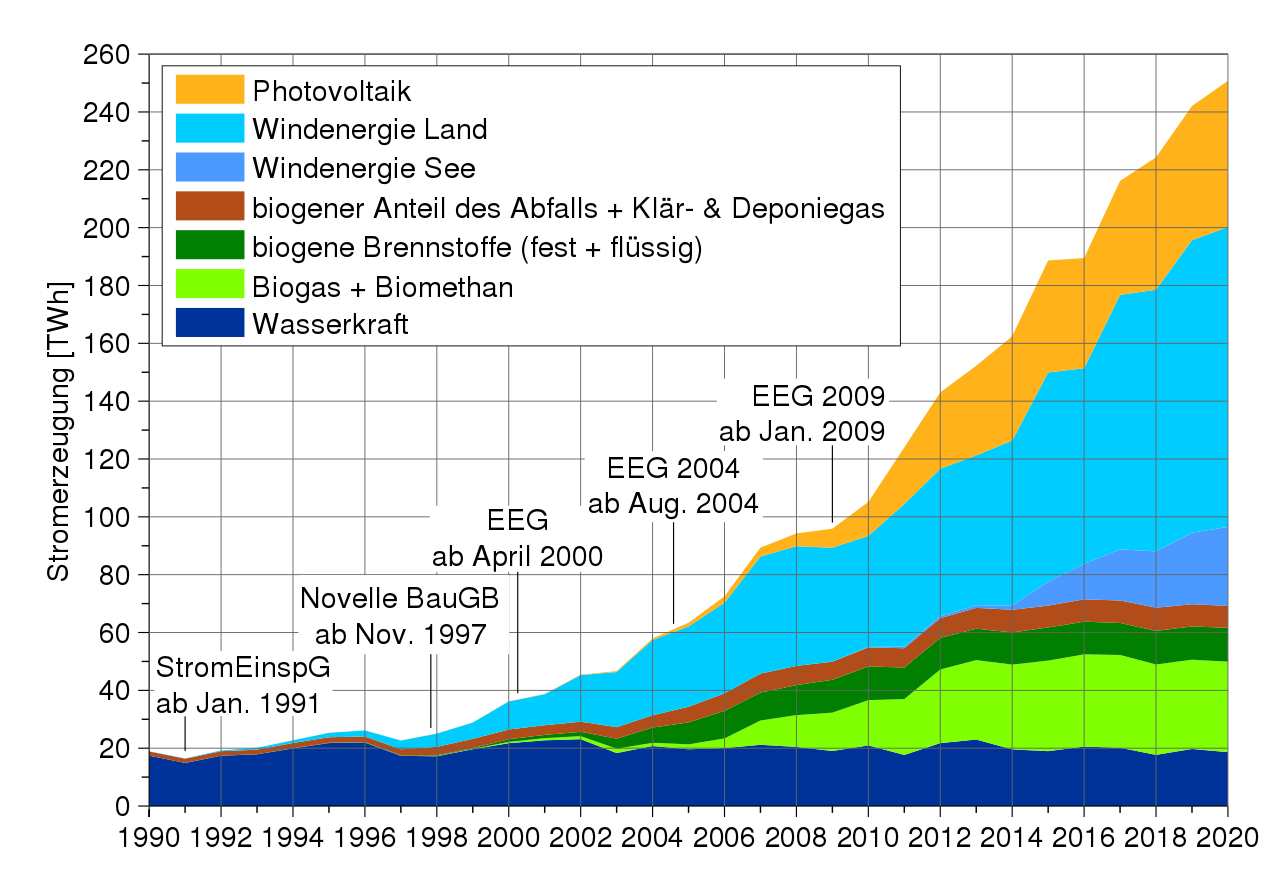
Deutsch: Entwicklung der Stromerzeugung aus erneuerbaren Energien in Deutschland seit 1990
Source

Zeitreihen zur Entwicklung der erneuerbaren Energien in Deutschland 1990-2020
unter Verwendung von Daten der Arbeitsgruppe Erneuerbare Energien-Statistik
(AGEE-Stat) (Stand: Februar 2021)
Tabelle 3: Bruttostromerzeugung aus erneuerbaren Energien 1990 bis 2020

https://www.erneuerbare-energien.de/EE/Redaktion/DE/Downloads/zeitreihen-zur-entwicklung-der-erneuerbaren-energien-in-deutschland-1990-2020.pdf?__blob=publicationFile&v=31
Author
Original:
Vector:
Other versions
SVG development
InfoField
 
The source code of this SVG is invalid due to an error.
 
This W3C-invalid chart was created with MATLAB.
 
 This chart uses embedded text that can be easily translated using a text editor.
Source code
InfoField
Geothermische Stromerzeugung auf Grund geringer Strommengen nicht dargestellt

MATLAB code

Many code lines
function [  ] = EntwicklungStromerzeugungErneuerbareEnergien(  )
% The code generates only a basic image.
% The final work has to be done in inkscape.
% by Jahobr 2020-08-30 (update 2021-04-10)
%fontToUse = 'Helvetica Narrow'; % no support
fontToUse = 'Helvetica';
set(0, 'defaultAxesFontName', fontToUse)
set(0, 'defaultTextFontName', fontToUse)

foSizeToUse = 13;
set(0, 'DefaultTextFontSize', foSizeToUse);
set(0, 'DefaultAxesFontSize', foSizeToUse);

%% ##################### Data #########################

% https://www.erneuerbare-energien.de/EE/Redaktion/DE/Downloads/zeitreihen-zur-entwicklung-der-erneuerbaren-energien-in-deutschland-1990-2020.pdf?__blob=publicationFile&v=31
% Zeitreihen zur Entwicklung der erneuerbaren Energien in Deutschland
% unter Verwendung von Daten der Arbeitsgruppe Erneuerbare Energien-Statistik 
% (AGEE-Stat)(Stand: Februar 2021)
% Tabelle 3: Bruttostromerzeugung aus erneuerbaren Energien 1990 bis 2020
% Page 6/50

x = [...
    1990,  1991, 1992, 1993, 1994, 1995, 1996, 1997, 1998, 1999, 2000, 2001, 2002, 2003, 2004, 2005, 2006, 2007, 2008, 2009, 2010, 2011, 2012, 2013, 2014, 2015, 2016, 2017, 2018,  2019,  2020];
y = [
    17426,14891,17397,17878,19930,21780,21957,17357,17216,19647,21732,22733,23124,18322,20745,19638,20031,21170,20443,19031,20953,17671,21755,22998,19587,18977,20546,20150,17693, 19731, 18633; ... Wasserkraft
    72,     102,  281,  612,  927, 1530, 2073, 3025, 4579, 5639, 9703,10719,16102,19087,26019,27774,31324,40507,41385,39382,38371,49280,50948,51819,57026,72340,67650,88018,90484,101150,103662; ... Windenergie an Land
    0,        0,    0,    0,    0,    0,    0,    0,    0,    0,    0,    0,    0,    0,    0,    0,    0,    0,    0,   38,  176,  577,  732,  918, 1471, 8284,12274,17675,19467, 24755, 27303; ... Windenergie auf See
    1,        1,    4,    3,    7,    7,   12,   18,   35,   30,   60,   76,  162,  313,  557, 1282, 2220, 3075, 4420, 6583,11729,19599,26380,31010,36056,38726,38098,39401,45784, 46392, 50600; ... Photovoltaik
    4,        9,   14,   32,   51,   85,  118,  179,  210,  246,  925, 1112, 1485, 3392, 5162, 7478, 8819, 8699, 9296, 9746,10351,10516,10693,10555,10798,11034,10797,10644,11167, 11106, 11321; ... biogene Festbrennstoffe
    0,        0,    0,    0,    0,    0,    0,    0,    0,    0,    0,   15,   20,   52,  136,  116,  719,  948, 1088, 1632, 1278,  382,  246,  288,  334,  426,  489,  437,  452,   397,   384; ... biogene flüssige Brennstoffe
    1,        2,    3,    4,    6,   18,   31,   44,  118,  145,  445,  745, 1046, 1518, 1111, 1696, 3346, 8386,10957,13188,15300,18754,24383,25839,26917,28302,28904,29245,28655, 28245, 28702; ... Biogas
    0,        0,    0,    0,    0,    0,    0,    0,    0,    0,    0,    0,    0,    0,    0,    0,    0,   20,   44,   78,  372,  576, 1080, 1625, 2398, 3011, 3010, 2837, 2602,  2620,  2585; ... Biomethan
    29,      25,   20,   24,   27,   34,   41,   48,  633,  727,  705,  735,  777,  955,  986, 1096, 1057, 1033, 1094, 1131, 1203, 1280, 1314, 1308, 1336, 1389, 1440, 1460, 1555,  1581,  1593; ... Klärgas
    188,    224,  259,  372,  485,  525,  565,  605,  677,  727,  812 , 748,  771,  793,  988, 1068, 1092, 1009,  864,  788,  674,  628,  536,  483,  435,  396,  358,  338,  306,   285,   285; ... Deponiegas
    1213,  1211, 1262, 1203, 1306, 1348, 1343, 1397, 1618, 1740, 1844, 1859, 1949, 2238, 2253, 3252, 3901, 4521, 4671, 4323, 4746, 4755, 4951, 5415, 6069, 5768, 5930, 5956, 6163,  5806,  5729; ... biogener Anteil des Abfalls
    0,        0,    0,    0,    0,    0,    0,    0,    0,    0,    0,    0,    0,    0,  0.2,  0.2,  0.4,  0.4,   18,   19,   28,   19,   25,   80,   98,  133,  175,  163,  178,   197,   217; ... Geothermie
]; % 

LegendText{1}  = 'Wasserkraft';
LegendText{2}  = 'Windenergie an Land';
LegendText{3}  = 'Windenergie auf See';
LegendText{4}  = 'Photovoltaik';
LegendText{5}  = 'biogene Festbrennstoffe';
LegendText{6}  = 'biogene flüssige Brennstoffe';
LegendText{7}  = 'Biogas';
LegendText{8}  = 'Biomethan';
LegendText{9}  = 'Klärgas';
LegendText{10} = 'Deponiegas';
LegendText{11} = 'biogener Anteil des Abfalls';
LegendText{12} = 'Geothermie';

%% ########################### full plot #######################

colmap = [...
    0    0.2  0.6; ... Wasserkraft
    0.0  0.8  1  ; ... Windenergie an Land
    0.3  0.6  1  ; ... Windenergie auf See
    1    0.7  0.1; ... Photovoltaik
    0    0.3  0  ; ... biogene Festbrennstoffe
    0    1    0.5; ... biogene flüssige Brennstoffe
    0.5  1    0  ; ... Biogas
    1    0.5  1  ; ... Biomethan
    0.7  0.3  0.1; ... Klärgas
    0.5  0.5  0  ; ... Deponiegas
    0.8  0.7  0.1; ... biogener Anteil des Abfalls
    1    0    0  ; ... Geothermie
    ]; %

figH = figure(55823); clf;
axeH  = axes;
hold on; box off; grid on
set(figH,'Position',[989   690   812   538])
colormap(colmap);

xLimits = x([1 end]);
xlim(xLimits)

set(axeH,'XTick',x(1:2:end));
set(axeH,'YTick',0:20:ceil(y(:,end)/10)*10);
set(axeH,'XMinorTick','on');
set(axeH,'YMinorTick','on');

hh = area(x',y'/1000,...
    'LineStyle','none');
ylabel('Stromerzeugung [TWh]')
legend(flip(hh),flip(LegendText),'Location','NorthWest'); % flip order to match the order in the plot

%% ########################### reduced plot #######################

y2(1 ,:) =  y(1,:);  % Wasserkraft
y2(6 ,:) =  y(2,:);  % Windenergie an Land
y2(5 ,:) =  y(3,:);  % Windenergie auf See
y2(7 ,:) =  y(4,:);  % Photovoltaik
y2(3 ,:) =  y(5,:) + y(6,:);  % biogene Festbrennstoffe + biogene flüssige Brennstoffe
y2(2 ,:) =  y(7,:) + y(8,:);  % Biogas + Biomethan
y2(4 ,:) =  y(9,:) + y(10,:) + y(11,:);  % Klärgas+ Deponiegas + biogener Anteil des Abfalls
% y2(8,:) =  y(12,:); % Geothermie too small to see

y2 = y2/1000; % from GWh to TWh

LegendText2{1}  = 'Wasserkraft';
LegendText2{6}  = 'Windenergie Land';
LegendText2{5}  = 'Windenergie See';
LegendText2{7}  = 'Photovoltaik';
LegendText2{3}  = 'biogene Brennstoffe (fest + flüssig)';
LegendText2{2}  = 'Biogas + Biomethan';
LegendText2{4}  = 'biogener Anteil des Abfalls + Klär- & Deponiegas';

colmap2(1 ,:) =  [0    0.2  0.6]; ... Wasserkraft
colmap2(6 ,:) =  [0.0  0.8  1  ]; ... Windenergie an Land
colmap2(5 ,:) =  [0.3  0.6  1  ]; ... Windenergie auf See
colmap2(7 ,:) =  [1    0.7  0.1]; ... Photovoltaik
colmap2(3 ,:) =  [0    0.5  0  ]; ... biogene Brennstoffe
colmap2(2 ,:) =  [0.5  1    0  ]; ... Biogas + Biomethan
colmap2(4 ,:) =  [0.7  0.3  0.1]; ... Klärgas+ Deponiegas + biogener Anteil des Abfalls

figH = figure(55824); clf;
axeH  = axes;
hold on; box off; grid on
set(figH,'Position',[989   690   812   538])
colormap(colmap2);

% set(axeH,'GridColor',[0.5 0.5 0.5]);
% set(axeH,'GridLineStyle','-');
% set(axeH,'GridAlphaMode','manual');
% set(axeH,'GridAlpha','0.15');

xLimits = x([1 end]);
xlim(xLimits)
yLimits = [0 ceil(sum(y2(:,end))/10)*10];
ylim(yLimits)

% set(axeH,'XTick',x(1:2:end));
% set(axeH,'YTick',0:20:yLimits(2));
% set(axeH,'XMinorTick','on');
% set(axeH,'YMinorTick','on');

set(axeH,'XTick',x(1:1:end));
set(axeH,'YTick',0:10:yLimits(2));
set(axeH,'XMinorTick','off');
set(axeH,'YMinorTick','off');

hh = area(x',y2',...
    'LineStyle','none');
ylabel('Stromerzeugung [TWh]')

legend(flip(hh),flip(LegendText2),'Location','NorthWest'); % flip order to match the order in the plot

plot([1 1]*1991,[19 31],'-k')
text(1990.2,31,{'StromEinspG';'ab Jan. 1991'},...
    'BackgroundColor',[1 1 1],...
    'HorizontalAlignment', 'left', ... left  center  right
    'VerticalAlignment','bottom'); % top  cap  middle  baseline  bottom

plot([1 1]*1997+(10/12),[27 55],'-k')
text(1997,55,{'Novelle BauGB   ';'ab Nov. 1997   '},...
    'BackgroundColor',[1 1 1],...
    'HorizontalAlignment', 'center', ... left  center  right
    'VerticalAlignment','bottom'); % top  cap  middle  baseline  bottom

plot([1 1]*2000+(3/12),[39 82],'-k')
text(2000+(3/12),82,{'EEG';'ab April 2000'},...
    'BackgroundColor',[1 1 1],...
    'HorizontalAlignment', 'center', ... left  center  right
    'VerticalAlignment','bottom'); % top  cap  middle  baseline  bottom

plot([1 1]*2004+(7/12),[63 100],'-k')
text(2004+(7/12),100,{'EEG 2004';'ab Aug. 2004'},...
    'BackgroundColor',[1 1 1],...
    'HorizontalAlignment', 'center', ... left  center  right
    'VerticalAlignment','bottom'); % top  cap  middle  baseline  bottom

plot([1 1]*2009,[98 125],'-k')
text(2010.5,125,{'EEG 2009';'ab Jan. 2009'},...
    'BackgroundColor',[1 1 1],...
    'HorizontalAlignment', 'right', ... left  center  right
    'VerticalAlignment','bottom'); % top  cap  middle  baseline  bottom

plot2svg('EntwicklungStromerzeugungErneuerbareEnergien.svg',figH) % by Juerg Schwizer, See http://www.zhinst.com/blogs/schwizer/ 
% now follows "post-production" using inkscape

end

Licensing[edit]

Public domain This image of simple geometry is ineligible for copyright and therefore in the public domain, because it consists entirely of information that is common property and contains no original authorship.
Heptagon
Heptagon

Original upload log[edit]

Transferred from de.wikipedia to Commons by Wdwdbot using script bot_filetrans.pl.

The original description page was here. All following user names refer to de.wikipedia.
  • 2013-09-08 20:18:21 Marsupilami (137915 Bytes) {{Information |Beschreibung = Entwicklung der Stromerzeugung aus erneuerbaren Energien in Deutschland seit 1990 |Quelle = In [http://www.erneuerbare-energien.de/fileadmin/ee-import/files/pdfs/allgemein/application/pdf/broschuere_ee_zahlen…

File history

Click on a date/time to view the file as it appeared at that time.

Date/TimeThumbnailDimensionsUserComment
current16:51, 10 April 2021Thumbnail for version as of 16:51, 10 April 2021700 × 480 (60 KB)Jahobr (talk | contribs)2020 update
21:20, 1 September 2020Thumbnail for version as of 21:20, 1 September 2020680 × 460 (54 KB)Jahobr (talk | contribs)removing the section <flowRoot xml:space="p... </flowRoot> at the end of the file. I hope the file is valide now.
17:05, 30 August 2020Thumbnail for version as of 17:05, 30 August 2020680 × 460 (55 KB)Jahobr (talk | contribs)legend box wider, wiki renders text differently
17:00, 30 August 2020Thumbnail for version as of 17:00, 30 August 2020680 × 460 (55 KB)Jahobr (talk | contribs)text bigger, better for wiki
10:50, 30 August 2020Thumbnail for version as of 10:50, 30 August 2020690 × 470 (53 KB)Jahobr (talk | contribs)up to 2019
17:33, 3 April 2017Thumbnail for version as of 17:33, 3 April 20171,040 × 770 (162 KB)Jahobr (talk | contribs)+2016 http://www.erneuerbare-energien.de/EE/Redaktion/DE/Downloads/zeitreihen-zur-entwicklung-der-erneuerbaren-energien-in-deutschland-1990-2016.pdf?__blob=publicationFile&v=12
21:19, 6 April 2016Thumbnail for version as of 21:19, 6 April 20161,000 × 760 (158 KB)Jahobr (talk | contribs)2015 added
00:44, 8 October 2015Thumbnail for version as of 00:44, 8 October 20151,024 × 623 (150 KB)Jahobr (talk | contribs)cosmetics
23:52, 7 October 2015Thumbnail for version as of 23:52, 7 October 20151,024 × 623 (145 KB)Jahobr (talk | contribs)added Years 2012 2013 2014
20:15, 16 August 2014Thumbnail for version as of 20:15, 16 August 20141,024 × 623 (135 KB)Wdwdbot (talk | contribs)Bot Move: Original uploader of this revision (#1) was Marsupilami at de.wikipedia

File usage on other wikis

Metadata