File:Temperature reconstruction last two millennia.svg

原始檔案 (SVG 檔案,表面大小:485 × 325 像素,檔案大小:134 KB)
說明
說明
摘要[編輯]

|
This SVG file contains embedded text that can be translated into your language, using any capable SVG editor, text editor or the SVG Translate tool. For more information see: About translating SVG files. |
| 描述 |
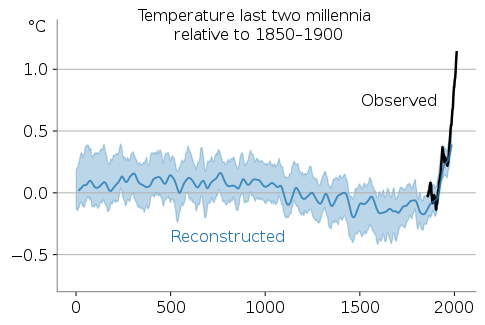
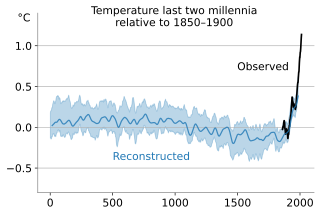
English: Temperatures with respect to the 1850–1900 mean over the last 2 millennia (blue) and observational estimates ranging from 1850 to 2020 (black). The shaded region contains the 68% confidence interval. The temperature anomalies are from the 2019 Nature Geoscience paper by the Pages2k Consortium.[1] using a wide set of proxies that have been vetted by the same consortium.[2] They include tree ring data, data from corals and ice core data.
The confidence interval incorporates two sources of uncertainty. The first one derives from the the method of translating information in the proxies into temperatures. Seven different peer-reviewed methods are employed and all considered equally likely in the figure. The methods range from a simple linear method where proxies sensitivities are fitted to the observational to determine past temperature, to more complicated methods in which information about spatial patterns is taken into account, or information about natural forcing is taken into account. The second type of uncertainty is in the selection of proxies. Some proxies might not be entirely reliable and their inclusion might slightly bias the reconstruction. By randomly selecting a subset of proxies, this uncertainty can be quantified. Code to create the figure is adapted from the Nature Geosciences paper[1] and can be found on https://figshare.com/collections/Global_mean_temperature_reconstructions_over_the_Common_Era/4507043. The figure is a simplification of Fig 1a from this paper. Individual reconstruction methods are not shown. The observational data is HadCRUT5, plotted with a ten-year running mean.[3] references
|
| 日期 | |
| 來源 | 自己的作品 |
| 作者 | Femke Nijsse |
| 其他版本 |
The above two-millennia chart is included in the following composites:
此檔案衍生的作品: |


授權條款[編輯]
- 您可以自由:
- 分享 – 複製、發佈和傳播本作品
- 重新修改 – 創作演繹作品
- 惟需遵照下列條件:
- 姓名標示 – 您必須指名出正確的製作者,和提供授權條款的連結,以及表示是否有對內容上做出變更。您可以用任何合理的方式來行動,但不得以任何方式表明授權條款是對您許可或是由您所使用。
- 相同方式分享 – 如果您利用本素材進行再混合、轉換或創作,您必須基於如同原先的相同或兼容的條款,來分布您的貢獻成品。
檔案歷史
點選日期/時間以檢視該時間的檔案版本。
| 日期/時間 | 縮圖 | 尺寸 | 使用者 | 備註 | |
|---|---|---|---|---|---|
| 目前 | 2023年4月3日 (一) 17:37 | | 485 × 325(134 KB) | Aspere(留言 | 貢獻) | File uploaded using svgtranslate tool (https://svgtranslate.toolforge.org/). Added translation for ko. |
| 2022年9月10日 (六) 10:18 |  | 485 × 325(133 KB) | Theklan(留言 | 貢獻) | File uploaded using svgtranslate tool (https://svgtranslate.toolforge.org/). Added translation for eu. | |
| 2022年1月9日 (日) 04:13 |  | 485 × 325(132 KB) | TAKAHASHI Shuuji(留言 | 貢獻) | File uploaded using svgtranslate tool (https://svgtranslate.toolforge.org/). Added translation for ja. | |
| 2021年12月17日 (五) 11:51 |  | 485 × 325(131 KB) | Gabriel Kielland(留言 | 貢獻) | File uploaded using svgtranslate tool (https://svgtranslate.toolforge.org/). Added translation for nb. | |
| 2021年12月14日 (二) 22:05 |  | 485 × 325(128 KB) | RCraig09(留言 | 貢獻) | 14 Dec 2021: per Talk page, nudging "Observed" to the right and anchoring at end of text so long-word translations will expand from right to left and not intersect the graph trace. | |
| 2021年12月7日 (二) 19:47 |  | 485 × 325(128 KB) | Chidgk1(留言 | 貢獻) | File uploaded using svgtranslate tool (https://svgtranslate.toolforge.org/). Added translation for tr. | |
| 2021年12月7日 (二) 15:19 |  | 485 × 325(124 KB) | GoEThe(留言 | 貢獻) | File uploaded using svgtranslate tool (https://svgtranslate.toolforge.org/). Added translation for pt. | |
| 2021年12月3日 (五) 16:44 |  | 485 × 325(121 KB) | Femke(留言 | 貢獻) | File uploaded using svgtranslate tool (https://svgtranslate.toolforge.org/). Added translation for nl. | |
| 2021年12月3日 (五) 16:42 |  | 485 × 325(121 KB) | Femke(留言 | 貢獻) | File uploaded using svgtranslate tool (https://svgtranslate.toolforge.org/). Added translation for es. | |
| 2021年12月3日 (五) 16:33 |  | 485 × 325(122 KB) | Femke(留言 | 貢獻) | Allow more space for translations |
無法覆蓋此檔案。
檔案用途
下列7個頁面有用到此檔案:
- File:2,000- and 139-year global average temperature.png
- File:2000 Year Temperature Comparison.png
- File:20200320 ~140 and ~2000 year global average temperature charts (full speed).webm
- File:800,000-, 2,000-, 139-year global average temperature.png
- File:Reconstrucción de las temperaturas de los dos últimos milenios.svg
- Category:Paleoclimatology
- Category:Proxy (climate)
全域檔案使用狀況
以下其他 wiki 使用了這個檔案:
- af.wikipedia.org 的使用狀況
- ar.wikipedia.org 的使用狀況
- ast.wikipedia.org 的使用狀況
- ba.wikipedia.org 的使用狀況
- bg.wikipedia.org 的使用狀況
- bh.wikipedia.org 的使用狀況
- ca.wikipedia.org 的使用狀況
- en.wikipedia.org 的使用狀況
- en.wikibooks.org 的使用狀況
- eo.wikipedia.org 的使用狀況
- es.wikipedia.org 的使用狀況
- eu.wikipedia.org 的使用狀況
- fi.wikipedia.org 的使用狀況
- fr.wikipedia.org 的使用狀況
- ga.wikipedia.org 的使用狀況
- gl.wikipedia.org 的使用狀況
- gu.wikipedia.org 的使用狀況
- he.wikipedia.org 的使用狀況
- hi.wikipedia.org 的使用狀況
- hu.wikipedia.org 的使用狀況
- ilo.wikipedia.org 的使用狀況
- it.wikipedia.org 的使用狀況
- kn.wikipedia.org 的使用狀況
- ko.wikipedia.org 的使用狀況
- la.wikipedia.org 的使用狀況
- lt.wikipedia.org 的使用狀況
- nl.wikipedia.org 的使用狀況
- no.wikipedia.org 的使用狀況
檢視此檔案的更多全域使用狀況。