User talk:Jrmanning
|
Our first steps tour and our frequently asked questions will help you a lot after registration. They explain how to customize the interface (for example the language), how to upload files and our basic licensing policy (Wikimedia Commons only accepts free content). You don't need technical skills in order to contribute here. Be bold when contributing and assume good faith when interacting with others. This is a wiki. More information is available at the community portal. You may ask questions at the help desk, village pump or on IRC channel #wikimedia-commons (webchat). You can also contact an administrator on their talk page. If you have a specific copyright question, ask at the copyright village pump. |
|
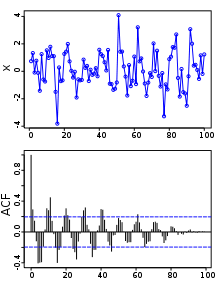
Acf_new.svg generated for autocorrelation[edit]
Hi Jeremy,
I had a problem replicating the figure you posted for the wikipage of Autocorrelation. You posted a R code that generates the figure.
................................................................
library(RSvgDevice)
x <- rnorm(100) + sin(2*pi*1:100/10)
devSVG("acf.pdf", width=3, height=4)
par(mfrow=c(2,1), mar=c(3.5, 3.5, 0.5, 0.5), mgp=c(2, 0.8, 0), cex=.7)
plot(x, type="o", col="blue", main=NA)
acf(x, 100, main=NA)
dev.off()
................................................................
So the data in the above figure in Acf_new.svg is 100 random numbers sampled from normal distribution plus a sine function. I then calculated the auto-correlation of these 100 numbers. But my figure is different from the below figure in Acf_new.svg. Sin function can be revealed but auto-correlation is not decaying to zero as Acf_new.svg showed.
Then I started to doubt the acf() function. Is it equivalent with the formula given in the section of Estimation (4th section) in the same wiki page?
Thanks!
