User:Mdd
|
Marcel Douwe Dekker (Mdd) (Delft 1964), Dutch systems engineer and conceptual artist participating in Wikipedia, Wikicommons, Wikiquote and Wiktionary, who started at the Dutch Wikipedia in September 2004.
Life and work, contributions to Wikipedia, and more specifically to Commons[edit]
After studying mechanical engineering, business administration and art I started in the early 1990s as artist and designer developing concepts across the fields of art, science, design and organization. This began with basic intuitive fascination for such things as expression, life, creation and destruction, and turned into investigating the process of systematization and visualization and the creation of a systematic world view.
The contributions I make to Wikipedia and Wikimedia Commons are part of my research & development as independent artist, in which I try to improve the representation on Wikipedia and Wikimedia Commons at the same time. I have uploaded over 7.500 images here to Wikimedia, some scanned from books, others moved from Wikipedia project. Most of these image have been copy/pasted from older or new online source after extensive search, which I call image scouting. For a significant part this concerns historical images almost lost and found, explicitly meant to for the transfer of cultural heritage to a global audience, and not for commercial exploration by third parties. Also, I contribute to the Commons organization through categorization. I started in 2008 when I significantly contributed to the creation of categories for all diagrams with over 10.000 edits. This is part of the 250.000 contributions in total I made to several Wikipedia projects over the years. Over the years I started and developed a series of galleries at commons, which are intended to give an overview both thematically and historically of the particular subjects. This can be helpful to structure the representation of those subjects in corresponding Wikipedia articles.
Due to a lack of illustrations in particular fields of the formal sciences, I have been creating a series of illustrations. In between I have done some documentary and portrait photography for Wikipedia. More recent in 2018 I have been donating some of my earlier photography from the pre-internet era (and have been writing corresponding Wikipedia articles). In recent years, focusing on the Netherlands, Wikimedia Commons has been granted a large donation of black and white images from social, political and cultural events. I think there are still large gabs of more recent pre-internet events. It would be great if we together continue to make Wikimedia Commons a place to represent this era, and collect images of notable events.
Most of my earlier photography is about people and events in the world of art and design in the 1990s. Hereby a smaller part is the upload of some of my work as a professional artist, which serves a dual purpose. I have been creating art and design for a period of just ten years from 1991 tot 2001 in practically all fields of visual art, hereby cooperation with a significant number of artists and designers. As a start a little over 100 artists, designers and scientists have been represented, which has continued to expand working along this bottom up approach. The presentation of a number of my own works gives both an introduction to this work, and serves as experiment to classify and present works of art and design in a coherent and representative way. In my later conceptual enterprises this is one of the main topics of research, coherent global representation. That has been the reason why I had started organizing the Wiki Commons category structure on diagrams in the first place.
Over the years in the background I worked on several overlapping smaller and larger categorization projects on what I could call next generation categorization, creating over 5.000 categories on Commons. As mentioned in 2008 I started categorizing all types of diagrams. In 2011-'12 I started with sculptors and ceramists from the Netherlands, and continued with social structures in the Dutch art world around main actors as art school, movements, prizes and galleries. More recent themes have been differentiated in historical frameworks, such as the posters of the Netherlands. By the end of 2021 there was the public domain donation of the Noord-Hollands Archief of the Beeldbank De Boer collection with about 2 million images of the Haarlem region. For some months I focused on this collection, and the import and categorization of three decades of images of the municipalities in that region.
Commons contributions : Galleries[edit]
- Visualization
- Main Chart, Diagram, Map and Technical drawing
- Acoustics diagram • Bar chart • Block diagram • Classification chart • Cluster diagram • Concept map (expanded) • Diagrams by period • Flow chart • Flow diagram • General diagram types • Graphs in graph theory • Logic diagram • Mathematical diagram • Medieval diagram • Network diagram • Pie chart • Plot• Specific diagram types • Table (information) • Tree diagram • Timeline • Train timetable
- Management, economics and other societal modelling
- Main Economic diagram, Management diagram
- Circular flow diagram • Cost accounting • Geographic diagram • History of accountancy • Old maps of Rotterdam • Organizational chart • Public administration diagram • Scientific management • Stock certificates • Time clock
- Systems and software engineering
- Activity diagram • Class diagram • Composite structure diagram • Process-data diagram • Software design patterns • Systems engineering • Unified Modeling Language
- Technology and technical visualisation
- Cognitive science
- Designers
- Specific types of economic activy and organisation
- History of agricultural illustration • History of cycling in the Netherlands • Machine shop • Stock exchange
.
Commons contributions : Images[edit]
Software and enterprise engineering illustrations (dating back from 2008)[edit]
-
 4+1 Architectural View Model
 -
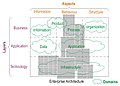 ArchiMate Architectural Framework
 -
 Database models.
 -
 Evolution of Enterprise Architecture Frameworks (redrawn)
 -
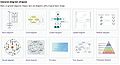 General diagram shapes
 -
 Extreme Programming (XP) loop
 -
 Dynamic Systems Development Method
 -
 GERAM Framework (redrawn)
 -
 RM-ODP viewpoints
 -
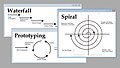 Software development methodology
 -
 Systems Development Life Cycle (redrawn)
 -
 Toronto Virtual Enterprise Ontologies
 -
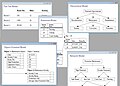
 TOVE Metamodel


Philosophy of science illustration (dating back from 2008)[edit]
-
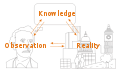 Observation, reality and theory, 2007.
 -
 The process of perception
 -
 The approach and framework of perception
 -
 Empirische cyclus, 2007.
 -
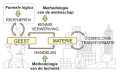 Vormen van methodologie, 2007.
 -
 Process of problem solving, 2009.
 -
 Cybernetic factory, 2007
 -
 Systems thinking about society
 -
 Cybernetic thinking about factories
 -
 Theory of Forms according to Plato


Portrait and documentary pictures (dating back from 2008)[edit]
-
 Amnesty in actie 1990, Rotterdam maart 1990.
 -
 Henk Bikker, TU Delft 1991
 -
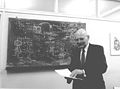
 Jan in 't Veld, 1991
 -
 American Dream, Maart 1991
 -
 Learning numbers 1991


Commons contributions : Categories, selection[edit]
- Overview
In the listing below there is short selection of the categories I created on Wikimedia Commons for documentation and information retrieval purposes. The first category I created was the Category:Systems biology on 14 May 2007. In those early years I focused on the interdisciplinary field of systems theory and the fields of visualization. It was the challenge to divide categories in such a coherent way, that the whole scope of science and visualization was covered in such a way that information retrieval is optimized. In those early years a global categorization bone structure was developed, which most of it has lasted so far and I guess has prove its usefulness.
- Listing (Old listing dating back from 2008)
- Science
Scientific books
- Category:Anatomy books • Category:Chemistry books • Category:Economy books • Category:Physics books • Category:Scientific books • Category:Scientific journals • Category:Scientific literature
Scientists categories
- Category:Applied scientists • Category:Artificial intelligence researchers • Category:Chaos theorists • Category:Charles Sanders Peirce • Category:Cognitive scientists • Category:Complex systems scientists • Category:Control theorists • Category:Cyberneticists • Category:Decision making • Category:Engineers from Mexico • Category:Nicholas Oresme • Category:Operations researchers • Category:Physicists from Mexico • Category:Scientists from Suriname • Category:Scientists from Ecuador • Category:Scientists from Turkey • Category:Systems biologists • Category:Systems engineers • Category:Systems psychologists • Category:Systems scientists
- Systems theory
Systems theory categories
- Category:Conceptual systems • Category:Information systems • Category:Logicians • Category:Operations research • Category:Physical systems • Category:Scientific modeling • Category:Systems • Category:Systems biology • Category:Systems dynamics • Category:Systems theory diagrams • Category:Systems scientists
Systems engineering Categories
- Category:Business process modeling • Category:Business Process Modeling Notation • Category:Configuration management • Category:Space system configurations • Category:Systems engineers • Category:Systems engineering • Category:Diagrams from Systems Engineering Fundamentals • Category:Information technology management • Category:Requirements analysis • Category:Systems Development Life Cycle • Category:Work breakdown structures
- Software engineering
General categories
- Category:Computer science diagrams • Category:Computer scientists from the Netherlands • Category:Data model (GIS) • Category:Data modeling • Category:Data types • Category:Dynamic Systems Development Method • Category:Enterprise architecture • Category:Enterprise modelling • Category:EXPRESS • Category:Integrated Enterprise Modeling • Category:IDEF • Category:IDEF0 • Category:IDEF1X • Category:IDEF3 • Category:IDEF5 • Category:Jackson Structured Programming • Category:Extended Enterprise Modeling Language • Category:LePUS3 • Category:Modeling languages • Category:NIAM • Category:Object-oriented design • Category:Object role modeling • Category:Ontology (computer science) • Category:SADT • Category:Service-oriented architecture • Category:Service-oriented modeling • Category:Software configurations • Category:Software development methodology • Category:Software development process • Category:Structured analysis • Category:Zachman Framework
Specific software engineering diagram categories
- Category:Component diagrams • Category:Composite structure diagrams • Category:Computer architecture diagrams • Category:Computer arithmetic • Category:Computer charts • Category:Computer network diagrams • Category:Computer science charts • Category:Computer science flowcharts • Category:Computer science graphs • Category:Computer science venn diagrams • Category:Interaction overview diagrams • Category:Logical computer diagrams • Category:Nassi-Shneiderman diagrams • Category:Object diagrams • Category:Process-data diagram • Category:Package diagrams • Category:Sequence diagrams • Category:Spiral model of Boehm • Category:Time-state diagrams • Category:UML Activity diagrams • Category:UML Communication diagrams • Category:UML State diagrams • Category:Use Case diagrams
- Visualization
General categories
- Category:Data visualization • Category:Diagram legends • Category:Diagrams by theme • Category:Diagrams by type • Category:Engineering diagrams • Category:Geographic information systems • Category:History of visualization • Category:Information visualization • Category:Map legends • Category:Plots by type • Category:Scientific visualization • Category:Thermodynamic diagrams • Category:Viewpoints • Category:Visual analytics • Category:Visualization •
Specific categories
- Category:3D area charts • Category:3D bar charts • Category:3D line charts • Category:3D phase diagrams • Category:3D pie charts • Category:3D Spectrogram • Category:3D tree diagrams • Category:Acoustics diagrams • Category:Actor diagrams • Category:Agricultural charts • Category:Agricultural diagrams • Category:Agricultural illustrations • Category:Agricultural machine illustrations • Category:Agricultural maps • Category:Agricultural stamps • Category:Agricultural tools illustrations • Category:Agriculture in heraldry • Category:Alphabet charts • Category:Anthropology diagrams • Category:Archaeological diagrams • Category:Astronomy cluster diagrams • Category:Brainstorming • Category:Beef illustrations • Category:Bubble maps • Category:Cattle illustrations • Category:Cereals illustrations • Category:Clusters • Category:Cluster diagrams • Category:Context diagrams • Category:Countryside illustrations • Category:Crop illustrations • Category:Cycle diagrams • Category:Decision diagrams • Category:Decomposition diagrams • Category:Deployment diagrams • Category:Economic bar charts • Category:Economic block diagrams • Category:Economic charts • Category:Economic circular flow diagrams • Category:Economic diagrams • Category:Economic graphs • Category:Economic illustrations • Category:Economic pie charts • Category:Explanatory diagrams • Category:Existential graphs • Category:Fault tree diagrams • Category:Flow maps • Category:Fruit illustrations • Category:Function block diagrams • Category:Functional flow block diagrams • Category:GDP bar charts • Category:Heat exchanger diagrams • Category:Image compressing • Category:Ladder diagrams • Category:Line charts • Category:Livestock diagrams • Category:Livestock illustrations • Category:Maize illustrations • Category:Management charts • Category:Management graphs • Category:Management icons • Category:N2 Charts • Category:National Geologic Map Database Project • Category:Neural network diagrams • Category:Nolan charts • Category:Organizational charts • Category:Organizational timelines • Category:Parse trees • Category:PERT charts • Category:Plough illustrations • Category:Process diagrams • Category:Run charts • Category:Sankey diagrams • Category:Smith charts • Category:Snellen charts • Category:Sociological bar charts • Category:Sociological charts • Category:Spiral curves • Category:Spiral diagrams • Category:Square of opposition • Category:Star plots • Category:Steam generator diagrams • Category:Stellation diagrams • Category:Strasburgers flower diagrams • Category:Structure charts • Category:Systems theory diagrams • Category:Thermodynamic diagrams • Category:Time diagrams • Category:Timing diagrams • Category:Triangular diagrams • Category:Truth tables • Category:Violin plots • Category:Web maps • Category:Wikimedia organizational charts • Category:Wikipedia diagrams • Category:Wikipedia decision diagrams
- Visualization history
Categories
- Category:Diagrams by century made • Category:Ancient diagrams • Category:Medieval diagrams • Category:16th-century diagrams • Category:17th-century diagrams • Category:18th-century diagrams • Category:19th-century diagrams • Category:19th-century flower diagrams • Category:20th-century diagrams • Category:1900s diagrams • Category:1910s diagrams • Category:1910s technical drawings • Category:1920s diagrams • Category:1920s technical drawings • Category:1930s diagrams • Category:1930s technical drawings • Category:1940s diagrams • Category:1940s technical drawings • Category:1950s diagrams • Category:1960s diagrams • Category:1970s diagrams • Category:1980s diagrams • Category:1990s diagrams • Category:21st-century diagrams • Category:2000 diagrams • Category:2001 diagrams • Category:2002 diagrams • Category:2003 diagrams • Category:2004 diagrams • Category:2005 diagrams • Category:2006 diagrams • Category:2007 diagrams • Category:2008 diagrams
.
- Further contrbutions in the field of categorization
Over the years by times I have kept contributing to Commons uploading images, and creating the accompanying Wikimedia Commons categories to store those images in the process. By autumn 2021 I have created over 3.000 categories, and multiple other category bone structures. In a way these categories map more specific fields of science and society. I believe this to be a never ending story to satisfy the growing need to keep Wikimedia Commons a nice place to look around.
See also[edit]
- Template:Useful-object-US, see also here
- Template:PD-US-not renewed, link to double check, and example how to explain.
- Mdd user statistics on Commons at wikiscan.org
- Glamtools/glamorous, use of images uploaded by Mdd
- Commons Wikimedia pageviews analysis
- Template:NoUploads
- Commons:Copyright rules by subject matter
- Commons:Own work/Bystander selfie
External links[edit]
- Mdd website op archive.org (partly in English).
| This user has an account on Flickr. |