File:Carbon cycle-cute diagram.svg
Vai alla navigazione
Vai alla ricerca

Dimensioni di questa anteprima PNG per questo file SVG: 600 × 460 pixel. Altre risoluzioni: 313 × 240 pixel | 626 × 480 pixel | 1 002 × 768 pixel | 1 280 × 981 pixel | 2 560 × 1 963 pixel.
File originale (file in formato SVG, dimensioni nominali 600 × 460 pixel, dimensione del file: 65 KB)
Didascalie
Didascalie
Aggiungi una brevissima spiegazione di ciò che questo file rappresenta
Dettagli[modifica]
| Descrizione |
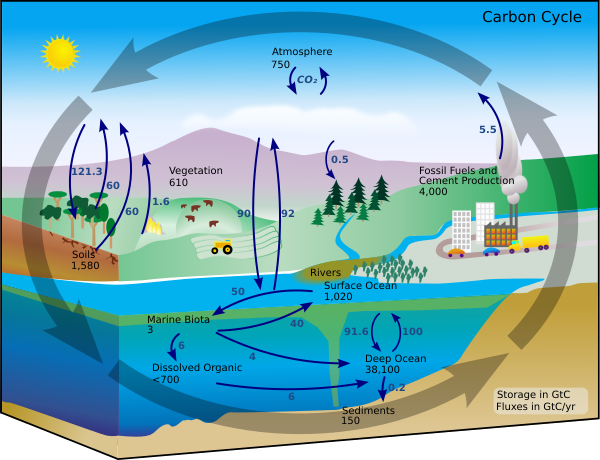
Deutsch: Diagramm des Kohlenstoffkreislaufes. Die schwarzen Zahlen zeigen wie viele Milliarden Tonnen Kohlenstoff (Gt C) in den verschiedenen Resevoiren vorhanden sind. Die blauen Zahlen zeigen an, wie viel Kohlenstoff zwischen den einzelnen Speichern pro Jahr ausgetauscht wird.
English: This carbon cycle diagram shows the storage and annual exchange of carbon between the atmosphere, hydrosphere and geosphere in gigatons - or billions of tons - of Carbon (GtC). Burning fossil fuels by people adds about 5.5 GtC of carbon per year into the atmosphere.
Español: Este esquema del ciclo del carbono muestra el almacenamiento y los cambios anuales del s entre la atmósfera, la hidrósfera y la geósfera en gigatones, o miles de millones de toneladas, de carbono (GtC). La quema de combustibles fósiles libera cerca de 5.5 mil millones de toneladas de carbono al año en la atmósfera.
Galego: Este esquema do ciclo do carbono amosa o almacenamento e os cambios anuais do carbono entre a atmosfera, a hidrosfera e a xeosfera en xigatóns, ou miles de millóns de toneladas, de carbono (XtC). A queima de combustibles fósiles libera preto de 5.5 mil millóns de toneladas de carbono ó ano na atmosfera.
日本語: 炭素循環の概念図。黒の数値はそれぞれのリザーバーに存在する炭素量、青の数値はリザーバー間での年間の炭素の移動量。単位はギガt(10億トン)
Русский: Схема геохимического цикла углерода показывает количество углерода в атмосфере, гидросфере и геосфере Земли, а также годовой перенос углерода между ними. Все величины приведены в гигатоннах (миллиардах тонн). В результате сжигания ископаемого топлива, человечество ежегодно добавляет 5,5 гигатонн углерода в атмосферу. |
||
| Data | |||
| Fonte | Opera propria basata su: Carbon cycle-cute diagram.jpeg (i.e. https://earthobservatory.nasa.gov/features/CarbonCycle) | ||
| Autore |
Vettoriale: |
||
| Licenza (Riusare questo file) |
|
||
| Altre versioni |
File:Carbon cycle-cute diagram.svg has 18 embedded translations.
[] Single-language versions
|
||
| SVG sviluppo | This diagram is translated using SVG switch elements: all translations are stored in the same file. |


Registro originale del caricamento[modifica]
This image is a derivative work of the following images:
- File:Carbon cycle-cute diagram.jpeg licensed with PD-USGov-NASA, PD-USGov-NASA/copyright
- 2006-09-12T15:16:24Z Giac83 540x417 (53453 Bytes) {{Information| |Description= This [[:en:carbon cycle]] diagram shows the storage and yearly changes of the carbon between the [[:en:Earth's atmosphere|atmosphere]], [[:en:hydrosphere]] and [[:en:geosphere]] in Gigatons - or b
Uploaded with derivativeFX
Cronologia del file
Fare clic su un gruppo data/ora per vedere il file come si presentava nel momento indicato.
| Data/Ora | Miniatura | Dimensioni | Utente | Commento | |
|---|---|---|---|---|---|
| attuale | 20:26, 1 apr 2024 | | 600 × 460 (65 KB) | Pko (discussione | contributi) | Reverted to version as of 10:00, 8 September 2021 (UTC) |
| 13:26, 12 dic 2021 |  | 600 × 460 (79 KB) | Pko (discussione | contributi) | File uploaded using svgtranslate tool (https://svgtranslate.toolforge.org/). Added translation for pl. | |
| 10:00, 8 set 2021 |  | 600 × 460 (65 KB) | Pavouk (discussione | contributi) | fix small error | |
| 09:53, 8 set 2021 |  | 600 × 460 (65 KB) | Pavouk (discussione | contributi) | add Czech labels (correct numbers) | |
| 07:04, 28 ago 2021 |  | 600 × 460 (65 KB) | Sarang (discussione | contributi) | Version cleaned from toolforge-translator failures (222 W3C errors), structured: now easy to add more languages using a text editor | |
| 18:40, 19 ago 2021 |  | 512 × 393 (88 KB) | Glrx (discussione | contributi) | add systemLanguage="vi" in Dissolved Organic switch // Editing SVG source code using c:User:Rillke/SVGedit.js | |
| 01:52, 21 apr 2021 |  | 512 × 393 (88 KB) | Tttrung (discussione | contributi) | add Vietnamese translation | |
| 17:12, 19 feb 2021 |  | 512 × 393 (85 KB) | YoaR (discussione | contributi) | File uploaded using svgtranslate tool (https://svgtranslate.toolforge.org/). Added translation for ast. | |
| 11:40, 8 ago 2020 |  | 512 × 393 (80 KB) | Persia (discussione | contributi) | File uploaded using svgtranslate tool (https://svgtranslate.toolforge.org/). Added translation for fa. | |
| 09:05, 24 lug 2020 |  | 512 × 393 (62 KB) | Sarang (discussione | contributi) | The TOOLFORGE translations since 2020-07-08 generated 696 ID attributes, with 52 not-unique occurrencies = 52 W3C errors. The code is now cleaned from that garbage of ID and tspan. Please do not use buggy tools like Toolforge again! Insert new languages with a text editor. |
Impossibile sovrascrivere questo file.
Utilizzo del file
Le seguenti 21 pagine usano questo file:
- Diagram
- General diagram types
- User:Ixocactus/Favorites
- User:Magog the Ogre/Multilingual legend/2020 April 21-30
- User:Magog the Ogre/Multilingual legend/2020 August 1-10
- User:Magog the Ogre/Multilingual legend/2020 July 1-10
- User:Magog the Ogre/Multilingual legend/2020 July 11-20
- User:Magog the Ogre/Multilingual legend/2020 July 21-31
- User:Magog the Ogre/Multilingual legend/2021 April 21-30
- User:Magog the Ogre/Multilingual legend/2021 December 11-20
- User:Magog the Ogre/Multilingual legend/2021 February 19-28
- User:Magog the Ogre/Multilingual legend/2021 September 1-10
- User:Magog the Ogre/Multilingual legend/2024 April 1-5
- User:Pablo Busatto/Favorites
- File:Carbon cycle-cute-diagram-fi.svg
- File:Carbon cycle-cute diagram-german.png
- File:Carbon cycle-cute diagram.jpeg
- File:Carbon cycle-cute diagram.svg
- File:Carbon cycle-cute diagram ar.svg
- File:Carbon cycle-cute diagram da.svg
- File:Carbon cycle-cute diagram ta.svg
Utilizzo globale del file
Anche i seguenti wiki usano questo file:
- Usato nelle seguenti pagine di af.wikipedia.org:
- Usato nelle seguenti pagine di ami.wikipedia.org:
- Usato nelle seguenti pagine di ar.wikipedia.org:
- Usato nelle seguenti pagine di ast.wikipedia.org:
- Usato nelle seguenti pagine di as.wikipedia.org:
- Usato nelle seguenti pagine di az.wikipedia.org:
- Usato nelle seguenti pagine di beta.wikiversity.org:
- Usato nelle seguenti pagine di bg.wikipedia.org:
- Usato nelle seguenti pagine di bs.wikipedia.org:
- Usato nelle seguenti pagine di cs.wikipedia.org:
- Usato nelle seguenti pagine di da.wikipedia.org:
- Usato nelle seguenti pagine di de.wikipedia.org:
- Usato nelle seguenti pagine di de.wikibooks.org:
- Usato nelle seguenti pagine di el.wikipedia.org:
- Usato nelle seguenti pagine di en.wikipedia.org:
- Carbon
- Natural capital
- Carbon cycle
- Environmental economics
- Ecological economics
- Kerogen
- Primary production
- Biological pump
- Urban ecology
- Biogeochemical cycle
- C4 carbon fixation
- Photorespiration
- Solubility pump
- Continental shelf pump
- Dissolved inorganic carbon
- Total organic carbon
- Carbonate compensation depth
- Redfield ratio
- Carbon-based life
Visualizza l'utilizzo globale di questo file.
Metadati
Categorie:
- 3D diagrams
- Carbon cycle
- Multilingual SVG diagrams
- Asturian-language SVG diagrams
- Catalan-language SVG diagrams
- Croatian-language SVG diagrams
- Danish-language SVG diagrams
- Dutch-language SVG diagrams
- English-language SVG diagrams
- Finnish-language SVG diagrams
- Galician-language SVG diagrams
- German-language SVG diagrams
- Italian-language SVG diagrams
- Persian-language SVG diagrams
- Romanian-language SVG diagrams
- Slovene-language SVG diagrams
- Spanish-language SVG diagrams
- Tamil-language SVG diagrams