File:Solar spectrum en.svg
Bước tới điều hướng
Bước tới tìm kiếm

Kích thước bản xem trước PNG này của tập tin SVG: 800×600 điểm ảnh. Độ phân giải khác: 320×240 điểm ảnh | 640×480 điểm ảnh | 1.024×768 điểm ảnh | 1.280×960 điểm ảnh | 2.560×1.920 điểm ảnh.
Tập tin gốc (tập tin SVG, 800×600 điểm ảnh trên danh nghĩa, kích thước: 49 kB)
Chú thích
Chú thích
Ghi một dòng giải thích những gì có trong tập tin này
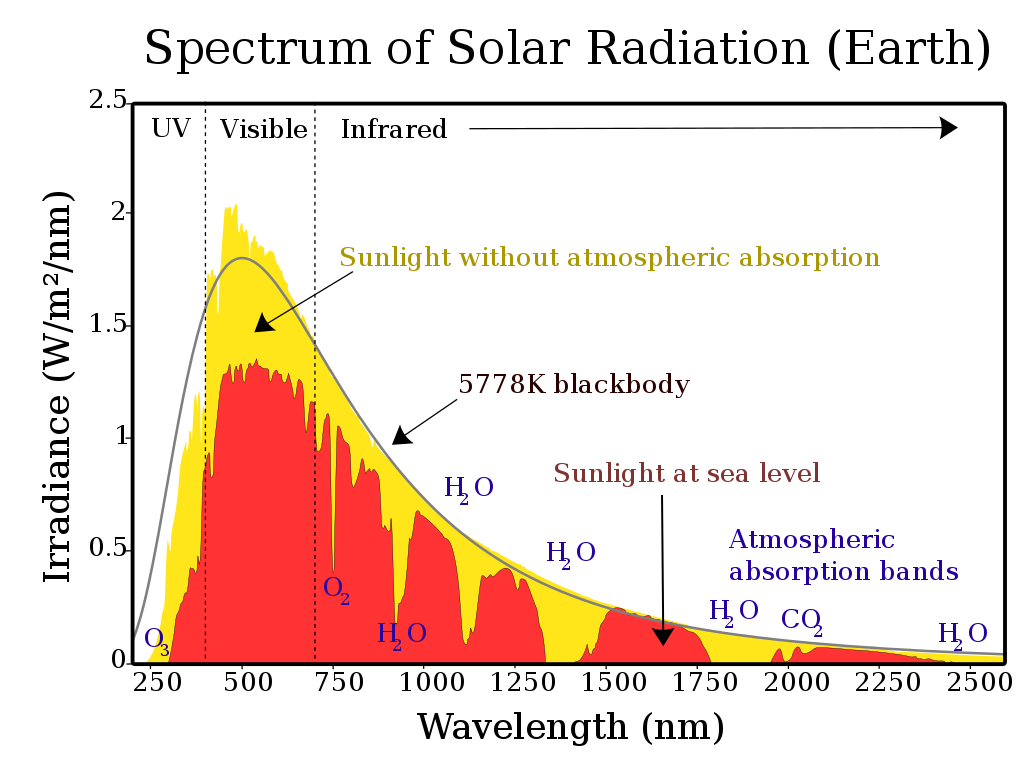
Spectrum of solar radiation at sea level (red) and out of the atmosphere (yellow)
Miêu tả
[sửa]| Miêu tả |
[]
Čeština: Tento obrázek ukazuje spektrum slunečního záření pro přímé světlo jednak na horní hranici zemské atmosféry (reprezentované žlutou oblastí), tak na hladině moře (červená oblast). Slunce produkuje světlo s distribucí podobnou tomu, co by se dalo očekávat od černého tělesa o teplotě 5778 K (5505 °C), což je přibližně povrchová teplota slunce. Jak světlo prochází atmosférou, část je absorbována plyny se specifickými absorpčními pásy. Další světlo je redistribuováno Rayleighovým rozptylem, který je zodpovědný za modrou barvu atmosféry. Tyto křivky jsou založeny na terestrickém referenčním spektru Americké společnosti pro testování a materiály (American Society for Testing and Materials, ASTM), což jsou standardy přijaté fotovoltaickým průmyslem, které zajišťují konzistentní zkušební podmínky a jsou podobné světlu, které lze očekávat v Severní Americe. Zobrazují se oblasti pro ultrafialové, viditelné a infračervené světlo. English: This figure shows the solar radiation spectrum for direct light at both the top of the Earth's atmosphere (represented by the area in yellow) and at sea level (area in red). The sun produces light with a distribution similar to what would be expected from a 5525 K (5250 °C) blackbody, which is approximately the sun's surface temperature. As light passes through the atmosphere, some is absorbed by gases with specific absorption bands. Additional light is redistributed by Rayleigh scattering, which is responsible for the atmosphere's blue color.
These curves are based on NREL data for above the atmosphere and at sea level, which are standards adopted by the photovoltaics industry to ensure consistent test conditions and are similar to the light that could be expected in North America. Regions for ultraviolet, visible and infrared light are indicated. Español: La figura muestra el espectro de radiación solar de luz directa tanto arriba de la atmósfera de la Tierra (representada por el área en amarillo) como al nivel del mar (área en rojo). El sol produce luz con una distribución similar a la que se esperaría de un cuerpo negro a 5525 °K (5250 °C), que es latemperatura aproximada de la superficie del Sol. Conforme la luz pasa a través de la atmósfera, parte de la luz es absorbida por gases en bandas de absorción específicas. Luz adicional se redistribuye por dispersión de Rayleigh, la cual es responsable por el color azul de la atmósfera. Estas curvas están basadas en datos del NREL arriba de la atmósfera y al nivel del mar, los cuales son estándares adoptados por la industria fotovoltaica para asegurar condiciones de prueba consistentes, y son similares a la luz que se podría esperar en Norte América. Se indican las regiones de luz ultravioleta, visible e infrarroja. Français : Cette figure montre le spectre solaire pour la lumière directe à la limite supérieure de l'atmosphère terrestre (représentée par la zone jaune) et au niveau de la mer (zone rouge). Le Soleil produit une lumière dont la distribution est similaire à celle que l'on attendrait d'un corps noir à 5778 K (5505 °C), ce qui correspond approximativement à la température de surface du Soleil. Lorsque la lumière traverse l'atmosphère, une partie est absorbée par des gaz présentant des bandes d'absorption spécifiques. D'autres rayons sont redistribués par la diffusion de Rayleigh, ce qui explique la couleur bleue de l'atmosphère. Ces courbes sont basées sur le spectre terrestre de référence de l'American Society for Testing and Materials (ASTM). Il s'agit de normes adoptées par l'industrie photovoltaïque pour garantir des conditions d'essai cohérentes et similaires à la lumière à laquelle on peut s'attendre en Amérique du Nord. Les zones de lumière ultraviolette, visible et infrarouge sont indiquées. Italiano: La figura mostra lo spettro della radiazione solare per illuminazione diretta sia all'inizio che alla fine del'atmosfera terrestra. Il sole produce una luce con una distribuzione simile a quella che ci si attenderebbe da un corpo nero a 5525 K (5250 °C), che è approssimativamente la temperatura superficiale del sole. A mano a mano che la luce passa attraverso l'atmosfera, parte della radiazione è assorbita dai gas in specifiche bande di assorbimento. Un contributo additivo è dovuto allo scattering Raleigh, che è responsabile per il colore blu dell'atmosfera.
Le curve sono basate sugli spettri di riferimento dell'American Society for Testing and Materials (ASTM), che sono standard adottati dall'industria fotovoltaica per assicurare condizioni di prova consistenti e sono simili al tipo di radiazione che è possibile aspettarsi nell'America del nord. Sono indicate le regioni per l'ultravioletto, il visibile e la luce infrarossa Polski: Rozkład widmowy promieniowania słonecznego. Português: A figua mostra o espectro da radiação solar direta, tanto na parte mais alta da atmosfera terrestre (representado pela área em amarelo) como ao nível do mar (área em vermelho). O Sol emite radiação com uma distribuição similar ao que seria esperado de um corpo negro a 5778 K (5505 °C), que é a temperatura aproximada da superfície do Sol. À medida que a luz passa pela atmosfera terrestre, parte dela é absorvida por gases, com bandas de absorção específicas. A luz também é redistribuída por meio do fenômeno conhecido como Dispersão de Rayleigh, responsável pela cor azul da atmosfera. As curvas do gráfico são baseadas no Espectro de Referência Terrestre da American Society for Testing and Materials (ASTM), que são padrões utilizados pela indústria de fotovoltaicos para garantir condições de ensaio consistentes; portanto, as curvas são similares ao espectro esperado na América do Norte. Regiões para luz ultravioleta, visível e infravermelha estão indicadas. עברית : ספקטרום השמש מעל האטמוספירה ובגובה פני הים العربية : طيف الشمس المأخوذ بالقمر الصناعي (أصفر) وعلى الأرض (أحمر) بالمقارنة بطيف الجسم الأسود. ينطبق طيف القمر الصناعي مع النظرية. ويتخلل طيف الشمس المأخوذ علي الأرض بعض الفجوات الناتجة عن امتصاص جو الأرض لبعض ترددات الأشعة |
||
| Ngày | |||
| Nguồn gốc | |||
| Tác giả | Robert A. Rohde | ||
| Phiên bản khác |
[]
|


Giấy phép
[sửa]
Tập tin này được phát hành theo Giấy phép Creative Commons Ghi công - Chia sẻ tương tự 3.0 Chưa chuyển đồi
- Bạn được phép:
- chia sẻ – sao chép, phân phối và chuyển giao tác phẩm
- pha trộn – để chuyển thể tác phẩm
- Theo các điều kiện sau:
- ghi công – Bạn phải ghi lại tác giả và nguồn, liên kết đến giấy phép, và các thay đổi đã được thực hiện, nếu có. Bạn có thể làm các điều trên bằng bất kỳ cách hợp lý nào, miễn sao không ám chỉ rằng người cho giấy phép ủng hộ bạn hay việc sử dụng của bạn.
- chia sẻ tương tự – Nếu bạn biến tấu, biến đổi, hoặc làm tác phẩm khác dựa trên tác phẩm này, bạn chỉ được phép phân phối tác phẩm mới theo giấy phép y hệt hoặc tương thích với tác phẩm gốc.
Lịch sử tập tin
Nhấn vào ngày/giờ để xem nội dung tập tin tại thời điểm đó.
| Ngày/Giờ | Hình xem trước | Kích cỡ | Thành viên | Miêu tả | |
|---|---|---|---|---|---|
| hiện tại | 16:10, ngày 13 tháng 5 năm 2019 | | 800×600 (49 kB) | Tuvalkin (thảo luận | đóng góp) | It's W, not kW, as further discussed: Reverted to version as of 20:57, 21 February 2016 (UTC) |
| 14:13, ngày 25 tháng 2 năm 2019 |  | 800×600 (49 kB) | Tuvalkin (thảo luận | đóng góp) | W → kW, as dicussed | |
| 20:57, ngày 21 tháng 2 năm 2016 |  | 800×600 (49 kB) | BenRG (thảo luận | đóng góp) | Replace 5250°C blackbody (seemingly miscalculated anyway) with standard 5778K blackbody; center-align captions; use Unicode ² instead of SVG superscript to fix rendering problems | |
| 22:21, ngày 7 tháng 1 năm 2015 |  | 800×600 (50 kB) | Bendhoward (thảo luận | đóng góp) | The Y-axis units were changed at some point to W/m^2, which is not correct. The units have been changed back to W/m^2/nm, in accordance with the units of the X-axis. | |
| 22:25, ngày 4 tháng 9 năm 2014 |  | 800×600 (50 kB) | TxBangert (thảo luận | đóng góp) | ... changed ^2 to superscript | |
| 22:18, ngày 4 tháng 9 năm 2014 |  | 800×600 (50 kB) | TxBangert (thảo luận | đóng góp) | fixed minor errors in how Wikipedia renders svg image | |
| 10:28, ngày 4 tháng 9 năm 2014 |  | 800×600 (50 kB) | TxBangert (thảo luận | đóng góp) | Updated the text to bring it in more in line with other European versions of this graph. W/m2/nm on the y axis is wrong. The units are simply W/m2, the x axis is nm. | |
| 14:50, ngày 4 tháng 3 năm 2013 |  | 800×600 (50 kB) | Arbeck (thảo luận | đóng góp) | Typo corrected - Atmosphere | |
| 15:44, ngày 14 tháng 2 năm 2013 |  | 800×600 (50 kB) | Arbeck (thảo luận | đóng góp) | Typo corrected: visible | |
| 15:44, ngày 14 tháng 2 năm 2013 |  | 800×600 (50 kB) | Arbeck (thảo luận | đóng góp) | Typo correctedvisible |
Bạn không được phép ghi đè tập tin này.
Trang sử dụng tập tin
15 trang sau sử dụng tập tin này:
- Commons:Open Access File of the Day/recent uploads/2016 February 20-24
- File:Radiation Spectrum.png
- File:Rayonnement solaire.svg
- File:Solar Spectrum.png
- File:Solar SpectrumPL.png
- File:Solar Spectrum He.png
- File:Solar spectrum-ar.svg
- File:Solar spectrum cs.svg
- File:Solar spectrum en.svg
- File:Solar spectrum fr.svg
- File:Solar spectrum it.svg
- File:Solar spectrum ita.svg
- File:Solar spectrum pt.svg
- File:Spectre solaire.png
- Template:Other versions/Solar spectrum
Sử dụng tập tin toàn cục
Những wiki sau đang sử dụng tập tin này:
- Trang sử dụng tại ca.wikipedia.org
- Trang sử dụng tại de.wikipedia.org
- Trang sử dụng tại el.wikipedia.org
- Trang sử dụng tại en.wikipedia.org
- Trang sử dụng tại es.wikipedia.org
- Trang sử dụng tại eu.wikipedia.org
- Trang sử dụng tại hak.wikipedia.org
- Trang sử dụng tại hi.wikipedia.org
- Trang sử dụng tại hu.wikipedia.org
- Trang sử dụng tại ig.wikipedia.org
- Trang sử dụng tại ja.wikipedia.org
- Trang sử dụng tại ms.wikipedia.org
- Trang sử dụng tại pt.wikipedia.org
- Trang sử dụng tại sk.wikipedia.org
- Trang sử dụng tại sl.wikipedia.org
- Trang sử dụng tại te.wikipedia.org
- Trang sử dụng tại uz.wikipedia.org
- Trang sử dụng tại vi.wikipedia.org